Essential Customer Retention Metrics to Boost Growth
May 24, 2025

Unlocking Growth: The Power of Customer Retention Metrics
Want to boost your bottom line? Focusing on customer retention is key. This listicle reveals seven essential customer retention metrics every Shopify store owner and e-commerce manager should track. Learn how to calculate and utilize Customer Retention Rate (CRR), Customer Churn Rate, Customer Lifetime Value (CLV or LTV), Net Promoter Score (NPS), Repeat Purchase Rate (RPR), Customer Satisfaction Score (CSAT), and Revenue Retention Rate. Mastering these customer retention metrics empowers data-driven decisions, optimized strategies, and ultimately, higher profitability.
1. Customer Retention Rate (CRR)
Customer Retention Rate (CRR) is a critical customer retention metric that measures the percentage of customers a business retains over a specific period. It provides a direct insight into how effectively your strategies are encouraging customers to stay engaged and continue purchasing. This metric is fundamental to understanding the health of your business, as repeat customers are often more valuable than new ones. They tend to spend more, refer new customers, and provide valuable feedback. CRR helps you understand how well you're building customer loyalty and identify potential churn risks before they impact your bottom line. A high CRR indicates a strong customer base and effective retention strategies, while a low CRR can signal underlying problems with customer satisfaction, product quality, or marketing efforts.

Calculating CRR involves a straightforward formula: CRR = ((E-N)/S) × 100, where 'E' represents the number of customers at the end of a specific period, 'N' is the number of new customers acquired during that period, and 'S' is the number of customers at the start of the period. For Shopify store owners, E-commerce Managers, and Shopify Plus Brands, understanding this metric is crucial for sustainable growth. Calculating your CRR manually can be time-consuming. A helpful tool to streamline this process is a customer retention rate calculator from CartBoss.
Features of CRR:
- Expressed as a percentage: This makes it easy to understand and compare across different periods.
- Time-bound: Typically measured monthly, quarterly, or annually, allowing for trend analysis.
- Simple Calculation: The formula is straightforward, making it accessible to businesses of all sizes.
Pros of using CRR:
- Clear snapshot of customer loyalty: Provides a direct indicator of how well your business retains customers.
- Easy to calculate and understand: Accessible and actionable for everyone on your team.
- Directly correlates with revenue stability and growth: Repeat customers contribute significantly to revenue.
- Early warning system: A declining CRR can highlight potential customer satisfaction issues.
Cons of using CRR:
- Doesn't account for customer value: All customers are treated equally, regardless of their spending habits.
- Doesn't explain churn reasons: While it identifies churn, it doesn't explain why customers leave.
- Can be skewed by segmentation: Different customer segments may have varying retention rates.
- Requires consistent customer definition: A clear definition of an 'active customer' is essential for accurate calculation.
Examples of successful CRR implementation:
- Netflix: Maintains high retention rates (over 90% in mature markets) by constantly adding new content and focusing on user experience.
- Amazon Prime: Achieves impressive retention (estimated 93-96%) by providing a compelling value proposition with free shipping, streaming services, and other benefits.
- Spotify: Boasts ~80% retention rates through personalized recommendations and continuous improvements to their platform.
Tips for maximizing CRR:
- Segment your data: Analyze retention rates across different demographics, acquisition channels, and product usage to identify areas for improvement.
- Benchmark against competitors: Understand how your CRR compares to industry averages to gauge your competitive positioning.
- Track alongside acquisition costs: Measure the true profitability of your customer acquisition efforts by considering both acquisition cost and retention rate.
- Set realistic goals: Establish attainable retention targets based on your industry, business model, and customer lifecycle.
Learn more about Customer Retention Rate (CRR) to delve deeper into the advantages of focusing on customer retention. Using CRR as a key performance indicator, alongside other customer retention metrics, is essential for any e-commerce business looking to achieve sustainable growth and build long-term customer relationships. By understanding, tracking, and optimizing your CRR, you can significantly impact your bottom line and build a loyal customer base that drives recurring revenue.
2. Customer Churn Rate
Customer Churn Rate is a crucial customer retention metric that measures the percentage of customers who stop using a company's products or services during a specific period. For Shopify store owners, e-commerce managers, and Shopify Plus brands, understanding and monitoring your churn rate is paramount to sustainable growth and profitability. It essentially tells you how well you’re retaining your hard-won customer base. This metric deserves its place on this list because it provides a direct measure of customer loyalty and highlights areas for improvement within your business.
How it Works:
The churn rate is calculated by dividing the number of customers lost during a period (e.g., a month, quarter, or year) by the total number of customers at the beginning of that period. The result is then multiplied by 100 to express it as a percentage.
Formula: Churn Rate = (Customers Lost / Total Customers at Start) × 100
Features and Benefits:
- Expressed as a Percentage: This allows for easy comparison across different periods and against industry benchmarks.
- Logo Churn vs. Revenue Churn: You can measure churn in terms of the number of customers lost (logo churn) or the value of the lost business (revenue churn). For Shopify businesses, tracking revenue churn can be particularly insightful as it accounts for the varying value of different customers.
- Early Warning System: A rising churn rate serves as a critical warning sign, indicating potential problems with your products, customer service, or overall customer experience. This allows you to take proactive steps to address these issues before they escalate.
Pros:
- Directly Highlights Customer Attrition Issues: Churn rate pinpoints the bleeding in your customer base, forcing you to confront the reasons behind customer departures.
- Revenue Impact Forecasting: Understanding your churn rate enables you to forecast the potential revenue impact of customer losses, aiding in more accurate financial planning.
- KPI for Subscription Businesses: Especially relevant for Shopify stores offering subscription boxes or recurring services, churn rate is a key performance indicator of the health and sustainability of the subscription model.
- Triggers Proactive Retention Initiatives: A rising churn rate should trigger proactive retention initiatives like targeted discounts, loyalty programs, or improved customer support.
Cons:
- Masking Underlying Issues (Without Segmentation): A general churn rate can mask underlying issues within specific customer segments. Segmenting your churn rate (e.g., by product purchased, acquisition channel, or customer lifetime value) provides a more granular view.
- Varying Acceptable Rates: Different business models have different acceptable churn rates. A high churn rate for a low-cost, high-volume product might be acceptable, while a lower churn rate is expected for high-value products or services.
- Customer Lifecycle Stages: Churn rate doesn't inherently account for customer lifecycle stages. Early-stage churn might be more acceptable than losing long-term, high-value customers.
- Voluntary vs. Involuntary Churn: The basic churn rate calculation doesn’t distinguish between voluntary churn (customers actively choosing to leave) and involuntary churn (e.g., failed payments, expired credit cards). Tracking both types separately is crucial.
Examples:
- High-Performing SaaS: While not directly comparable to e-commerce, SaaS companies like Salesforce maintaining annual churn rates below 10% is considered excellent and provides a benchmark for subscription-based Shopify businesses.
- Telecom Industry: Telecom providers often experience higher churn rates (10-25% annually), offering a point of reference for businesses operating in highly competitive markets.
Actionable Tips for Shopify Businesses:
- Identify Leading Indicators: Analyze customer usage patterns (website visits, purchase frequency, email engagement) to identify leading indicators of potential churn.
- Implement Exit Surveys: Use exit surveys or feedback forms to understand why customers are leaving your store. This invaluable data can inform your retention strategies.
- Calculate the Cost of Churn: Multiply lost customers by their lifetime value to understand the true financial impact of churn. This underscores the importance of retention efforts.
- Segmented Churn Reduction Strategies: Develop tailored churn reduction strategies for different customer segments. For example, offer exclusive discounts to loyal customers or personalized product recommendations to those at risk of churning.
- Track Voluntary and Involuntary Churn: Implement systems to track both voluntary and involuntary churn separately. This will allow you to address specific issues like payment processing problems or proactively reach out to customers who are considering leaving.
Popularized By:
The importance of churn rate has been highlighted by subscription businesses like Netflix and Spotify, SaaS industry metrics frameworks, and customer success thought leaders like Lincoln Murphy and Nick Mehta. Their work emphasizes the critical role of customer retention in building sustainable and profitable businesses.
3. Customer Lifetime Value (CLV or LTV)
Customer Lifetime Value (CLV or LTV) is a crucial customer retention metric that represents the total revenue a business can reasonably expect from a single customer throughout their entire relationship. Understanding CLV is essential for making informed decisions about sales, marketing, product development, and customer support. It helps businesses understand how much they can afford to spend on acquiring new customers (Customer Acquisition Cost or CAC) and how valuable different customer segments are over time, enabling them to prioritize their efforts and resources effectively. By focusing on maximizing CLV, businesses can build stronger customer relationships, improve profitability, and achieve sustainable growth. This is particularly important for Shopify store owners, e-commerce managers, Shopify Plus brands, and email marketers who rely heavily on repeat business and customer loyalty.
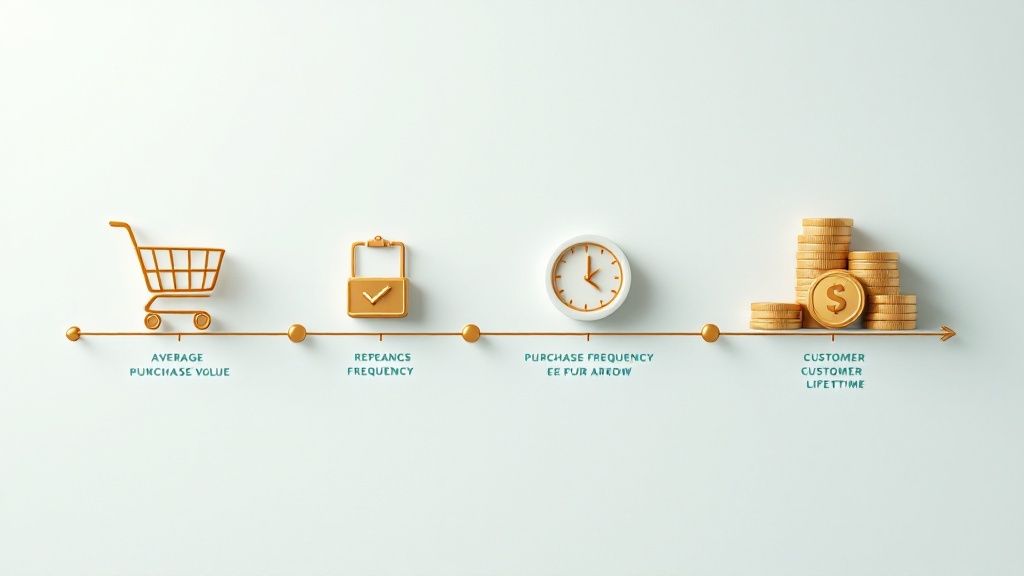
CLV is calculated by multiplying the average purchase value by the average purchase frequency rate and the average customer lifespan. This seemingly simple formula, CLV = Average Purchase Value × Average Purchase Frequency × Average Customer Lifespan, provides a powerful insight into the long-term value of a customer. More sophisticated models incorporate discount rates (to account for the time value of money) and contribution margins (to reflect the profitability of each sale). For example, if a customer spends an average of $50 per purchase, buys from your store 4 times a year, and remains a customer for 3 years, their CLV is $50 x 4 x 3 = $600.
Features and Benefits:
- Typically expressed as a monetary value: This allows for direct comparison with other financial metrics like CAC.
- Can be calculated as a historical metric or as a predictive one: Historical CLV helps analyze past performance, while predictive CLV helps forecast future revenue.
- Provides crucial context for customer acquisition spending: Knowing your CLV helps you determine a sustainable CAC and optimize your marketing budget.
- Helps identify most valuable customer segments: Segmenting customers by CLV allows you to tailor your marketing and retention strategies for maximum impact.
- Supports long-term planning and forecasting: CLV is a key input for revenue projections and business planning.
- Justifies investments in customer retention initiatives: A high CLV demonstrates the value of retaining existing customers and justifies spending on loyalty programs and other retention efforts.
Pros and Cons:
Pros: As mentioned above, understanding CLV provides a wealth of benefits, including improved customer acquisition strategies, targeted retention efforts, and better long-term financial planning.
Cons: Calculating CLV accurately can be complex, particularly for businesses with varied customer segments and purchase patterns. It relies on assumptions about future customer behavior which may not always hold true, especially in rapidly changing markets. Different calculation methods can also yield different results, making it essential to choose a method that aligns with your business model and consistently apply it.
Examples of Successful Implementation:
- Starbucks: Has reported an average CLV of approximately $14,000 per customer, demonstrating the power of building a loyal customer base through personalized experiences and a strong rewards program.
- Apple: Apple's CLV is estimated at over $30,000 for loyal customers, driven by a premium brand image, a strong ecosystem of products and services, and high customer retention rates.
- Amazon: Amazon Prime members have an estimated CLV of $3,000+ compared to non-Prime customers at around $700, showcasing the effectiveness of subscription models in increasing customer lifetime value.
Actionable Tips for Shopify Store Owners and E-commerce Professionals:
- Calculate CLV by customer segment: This will help you identify your most valuable customers and tailor your marketing efforts accordingly. For example, use Shopify's reporting features or integrate with a CLV calculation tool.
- Compare CLV to Customer Acquisition Cost (CAC): Ensure that your CLV significantly exceeds your CAC to ensure profitability. A good rule of thumb is a 3:1 ratio.
- Update CLV calculations regularly as market conditions change: Customer behavior can shift quickly, so regular updates are crucial.
- Use cohort analysis to track how CLV evolves over time: This provides deeper insights into customer behavior and the effectiveness of your retention strategies.
- Consider both monetary and non-monetary factors that influence lifetime value: Factors like customer referrals, social media engagement, and brand advocacy can also contribute to long-term value.
By understanding and actively managing CLV, e-commerce businesses can build stronger customer relationships, optimize their marketing spend, and drive sustainable growth. This metric deserves a prominent place in any customer retention strategy, serving as a guiding light for long-term business success.
4. Net Promoter Score (NPS)
Net Promoter Score (NPS) is a crucial customer retention metric that gauges customer loyalty and satisfaction by asking a simple yet powerful question: "How likely are you to recommend our company's products or services to a friend or colleague?" Customers respond on a scale of 0-10, segmenting them into three categories: Promoters (9-10), Passives (7-8), and Detractors (0-6). The NPS is then calculated by subtracting the percentage of Detractors from the percentage of Promoters, resulting in a score ranging from -100 to +100. This single metric provides a standardized measure of customer sentiment, correlating strongly with customer retention and potential for business growth, making it a vital tool for Shopify store owners, e-commerce managers, Shopify Plus brands, and email marketers.

This method deserves a place on any list of essential customer retention metrics because it offers a concise, easily understood snapshot of customer loyalty. Its simplicity leads to high response rates, providing valuable data for businesses of all sizes. Features like the standardized -100 to +100 scale and the single-question survey format contribute to its widespread adoption. The calculation (NPS = % of Promoters – % of Detractors) is straightforward, allowing for quick interpretation and benchmarking against competitors. Often, the initial NPS question is followed up with an open-ended question like "Why did you give us that score?" to gather qualitative insights and understand the drivers behind customer sentiment.
Pros:
- Simple to implement and understand: Easy integration into existing Shopify workflows and email marketing campaigns.
- Provides actionable insights: Especially when combined with qualitative feedback from follow-up questions.
- Facilitates benchmarking: Compare your store's performance against competitors within your industry.
- Correlates with revenue growth and customer retention: A higher NPS often translates to increased customer lifetime value.
- High response rates: The single-question format encourages participation.
Cons:
- Oversimplifies complex customer relationships: Doesn't capture the nuances of individual customer experiences.
- Cultural differences can affect scoring tendencies: Interpret results with consideration for your target audience's cultural background.
- Doesn't directly measure purchasing behavior: While correlated with retention, it doesn't predict future purchases definitively.
- Can be manipulated: Selective surveying can skew results.
- May not capture specific improvement opportunities without follow-up questions: Relying solely on the numerical score can limit actionable insights.
Examples: Companies known for exceptional customer experiences consistently achieve high NPS scores. Apple regularly scores above 70, USAA maintains an NPS above 75, and Costco reports scores of 79, placing it among the highest in retail. These examples demonstrate the link between a strong customer focus and a high NPS.
Tips for Shopify Store Owners and E-commerce Managers:
- Survey customers at consistent touchpoints: Post-purchase, after delivery, or following customer service interactions.
- Always follow up with "Why did you give that score?": This provides invaluable qualitative data.
- Segment NPS by customer demographics, product lines, or regions: Identify specific areas for improvement.
- Close the loop with detractors: Address their concerns and turn negative experiences into positive ones.
- Track NPS trends over time: Focus on improvement rather than fixating on a single score.
By understanding and utilizing NPS effectively, e-commerce businesses can gain a valuable perspective on customer loyalty, identify areas for improvement, and ultimately drive customer retention and business growth. Popularized by Fred Reichheld and Bain & Company in 2003 (detailed in Reichheld's book "The Ultimate Question"), NPS has become a cornerstone of customer-centric strategies for companies like Apple, Amazon, and Zappos. Adopting this metric can be a powerful step toward building a loyal customer base and thriving in the competitive e-commerce landscape.
5. Repeat Purchase Rate (RPR)
Repeat Purchase Rate (RPR) is a crucial customer retention metric that measures the percentage of customers who return to make additional purchases after their initial transaction. For Shopify store owners, e-commerce managers, Shopify Plus brands, and email marketers, understanding and optimizing RPR is paramount for driving sustainable growth and profitability. It directly reflects customer loyalty and satisfaction with your products or services, providing valuable insights into the health of your business. This metric deserves its place on this list because it focuses on actual purchasing behavior, giving you a clear picture of how well your retention strategies are performing.
How it Works:
RPR is calculated by dividing the number of customers who have made more than one purchase by the total number of customers, then multiplying by 100. This provides a percentage that represents the proportion of your customer base that has demonstrated repeat business. It can be expressed as:
Formula: RPR = (Number of Repeat Customers / Total Number of Customers) × 100
A key feature of RPR is its flexibility. It can be measured over various time periods, such as 30 days, 90 days, or even a full year, allowing you to track short-term and long-term customer loyalty trends. Furthermore, segmenting RPR by product categories or customer cohorts can reveal valuable insights into specific areas for improvement and opportunities for targeted marketing campaigns.
Why Use RPR?
RPR offers several advantages over other customer retention metrics:
- Direct Measurement of Behavior: Unlike metrics like customer satisfaction scores, which gauge intentions, RPR measures actual purchasing behavior, providing a more accurate reflection of customer loyalty.
- Indicator of Product Satisfaction and Brand Loyalty: A high RPR suggests that customers are satisfied with their initial purchase and are likely to become loyal brand advocates.
- Forecasting and Planning: RPR data helps you forecast inventory needs, predict revenue streams, and make informed business decisions.
- Targeted Marketing Opportunities: Understanding RPR allows you to identify opportunities for cross-selling and upselling to existing customers, maximizing their lifetime value.
Pros and Cons:
Pros:
- Directly measures actual purchasing behavior
- Indicates product satisfaction and brand loyalty
- Helps forecast inventory and revenue
- Identifies opportunities for cross-selling and upselling
Cons:
- May not be applicable for products with very long repurchase cycles (e.g., mattresses)
- Doesn't account for purchase value or frequency
- Can be influenced by promotional activities rather than true loyalty
- Doesn't explain why customers do or don't return
Examples of Successful Implementation:
- Sephora: Their Beauty Insider loyalty program encourages repeat purchases through exclusive rewards and personalized offers, leading to high RPR.
- Dollar Shave Club: Their subscription model boasts repeat purchase rates above 80%, highlighting the effectiveness of recurring revenue strategies.
- Stitch Fix: By personalizing offerings based on customer feedback, Stitch Fix maintains a high RPR and cultivates strong customer relationships.
Actionable Tips for Shopify Store Owners:
- Cohort Analysis: Track RPR by customer cohorts (e.g., customers acquired in a specific month) to understand how loyalty develops over time.
- Purchase Frequency Analysis: Analyze the time between purchases to optimize the timing of marketing communications and re-engagement campaigns.
- Product Category Comparison: Compare RPR across different product categories to identify strengths and weaknesses in your product offerings.
- Post-Purchase Surveys: Implement post-purchase satisfaction surveys to identify potential barriers to repeat purchases and gather valuable customer feedback.
- Predictive Analytics: Use predictive analytics to identify customers at risk of not making repeat purchases and proactively target them with personalized offers and incentives.
By diligently monitoring and optimizing your Repeat Purchase Rate, you can strengthen customer relationships, increase customer lifetime value, and drive sustainable growth for your Shopify store. This metric is an invaluable tool for understanding the true impact of your customer retention efforts and identifying areas for improvement in your overall business strategy.
6. Customer Satisfaction Score (CSAT)
Customer Satisfaction Score (CSAT) is a key customer retention metric that measures how satisfied customers are with a specific interaction, product, or service. It provides a snapshot of customer sentiment at various touchpoints, giving you valuable insights into what's working and what needs improvement. For Shopify store owners, e-commerce managers, Shopify Plus brands, and email marketers, understanding and leveraging CSAT is crucial for building a loyal customer base and driving repeat business. This metric deserves its place on the list of essential customer retention metrics because it offers direct feedback on customer experiences, allowing businesses to proactively address issues and improve customer satisfaction. By focusing on CSAT, you can create a more positive customer journey, leading to increased loyalty and ultimately, higher customer lifetime value.
CSAT is typically measured using a simple scale, most commonly 1-5 or 1-10, with higher scores indicating greater satisfaction. Customers are asked to rate their experience based on a specific interaction, such as a recent purchase, a customer service interaction, or even a specific product feature. The score is calculated by dividing the number of satisfied customers (typically those who selected 4-5 on a 5-point scale or 7-10 on a 10-point scale) by the total number of respondents, then multiplying by 100, resulting in a percentage. This percentage represents the overall satisfaction level for that particular interaction.
Features and Benefits:
- Expressed as a Percentage: CSAT is easy to understand and track, providing a clear overview of customer satisfaction levels.
- Flexible Scales: You can tailor the scale (e.g., 1-5, 1-7, 1-10) to fit your specific needs and target audience.
- Targeted Measurement: CSAT can be customized to assess satisfaction with specific interactions, products, or aspects of your service.
- Immediate Feedback: CSAT surveys provide real-time insights into customer experiences, enabling rapid response to issues.
- Predictive Power: Consistently low CSAT scores can be an early warning sign of potential churn, allowing you to take proactive measures.
Pros:
- Provides immediate feedback on specific experiences.
- Easy for customers to understand and complete.
- Flexible implementation across multiple touchpoints (e.g., post-purchase, after support interactions).
- Helps identify specific areas needing improvement.
- Can predict retention issues before they impact business metrics.
Cons:
- Subject to response bias (unhappy customers are often more motivated to respond).
- Cultural differences can influence how people rate satisfaction.
- Represents a point-in-time measurement and may not reflect the overall customer relationship.
- Satisfaction doesn't always equate to loyalty or repeat purchases.
- Rating scales can be interpreted differently by respondents.
Examples of Successful Implementation:
- Zappos: Known for their exceptional customer service, Zappos consistently maintains CSAT scores above 90%.
- Apple: The in-store Genius Bar experiences generally receive high CSAT scores, often exceeding 85%.
- JetBlue: This airline tracks CSAT after each flight to quickly address any service-related issues.
Actionable Tips for Shopify Store Owners:
- Keep surveys short and focused: Ask only what's essential for the specific interaction being measured.
- Follow up on negative feedback: Prioritize high-priority negative responses with personalized outreach.
- Strategic Implementation: Implement CSAT surveys at critical touchpoints in the customer journey, such as after purchase, delivery, or a customer service interaction.
- Add context: Combine CSAT ratings with open-ended questions to understand the "why" behind the score.
- Share the results: Communicate CSAT data with your customer-facing teams and tie it to performance metrics.
- Track trends: Focus on CSAT trends over time rather than fixating solely on absolute scores.
Learn more about Customer Satisfaction Score (CSAT)
By implementing these tips and consistently monitoring your CSAT scores, you can gain valuable insights into your customers' experiences and identify areas for improvement, ultimately contributing to stronger customer retention and business growth for your Shopify store. Using CSAT as one of your key customer retention metrics will help you identify pain points, optimize the customer journey, and build a more loyal customer base.
7. Revenue Retention Rate
Revenue Retention Rate (RRR) is a crucial customer retention metric, particularly for subscription-based businesses and e-commerce stores with repeat customers. It measures the percentage of revenue retained from existing customers over a specific period, typically monthly or annually. It provides a more financially grounded view of customer loyalty compared to simply counting customer numbers. Understanding RRR helps you gauge the effectiveness of your retention strategies and identify opportunities for growth within your existing customer base.
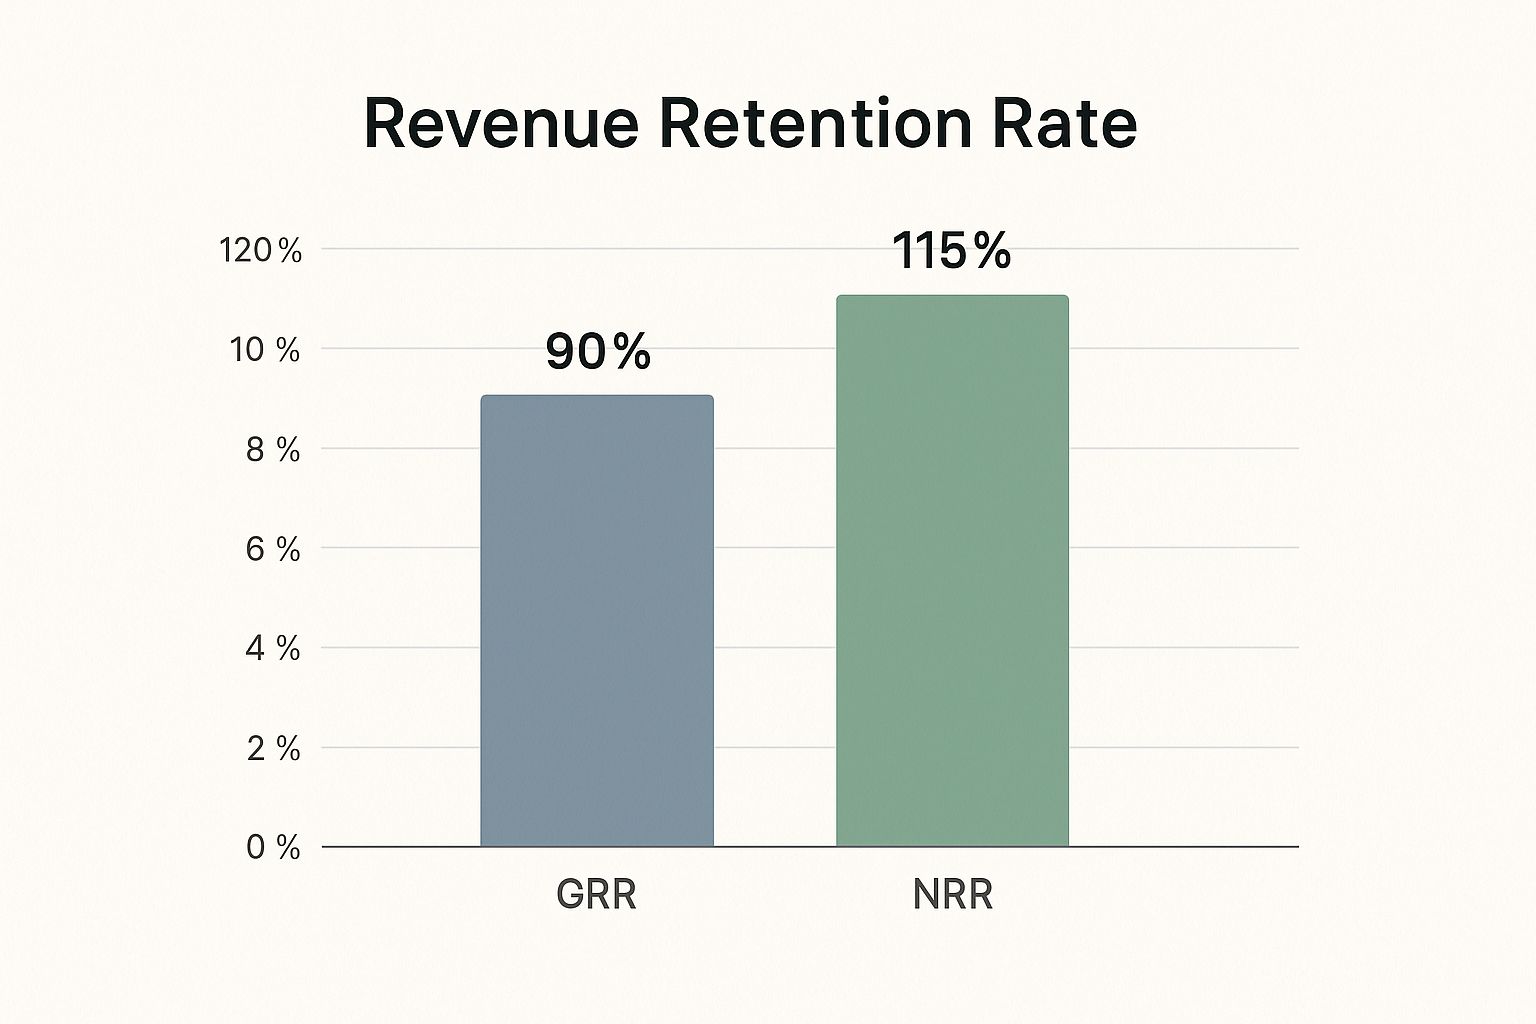
The infographic above visually represents the difference between Gross Revenue Retention (GRR) and Net Revenue Retention (NRR). It illustrates how a starting revenue of $100 can evolve over a period, considering expansion revenue (upsells, cross-sells) and revenue churn (lost customers or downgraded subscriptions). As the chart shows, even with some churn, the inclusion of expansion revenue can result in an NRR exceeding 100%, indicating overall revenue growth from the existing customer base.
RRR exists in two forms: Gross Revenue Retention (GRR) and Net Revenue Retention (NRR). GRR only considers revenue changes from existing customers, excluding any upsells or cross-sells. It provides a baseline for understanding how well you're retaining your existing revenue without the influence of expansion activities. NRR, on the other hand, includes expansion revenue from upsells, cross-sells, and upgrades. This provides a holistic view of revenue growth from your existing customer base. For example, if your starting monthly recurring revenue (MRR) is $100,000 and at the end of the month, you have $95,000 from existing customers without considering upsells, your GRR is 95%. If you also gained $15,000 from upsells during that month, your NRR would be 110% (($95,000 + $15,000) / $100,000) * 100.
Features:
- Expressed as a percentage.
- NRR can exceed 100%, while GRR typically won't.
- GRR excludes expansion revenue.
- NRR includes expansion revenue.
- Formula for NRR: (Starting Revenue + Expansion – Contraction – Churn) / Starting Revenue × 100
- Typically measured monthly (MRR) or annually (ARR).
Pros:
- More financially relevant than customer count metrics.
- Highlights the financial impact of customer retention efforts.
- NRR above 100% indicates growth even without new customer acquisition.
- Reveals expansion opportunities within the existing customer base.
- Combines retention and growth into a single metric.
Cons:
- Can mask customer churn if offset by expansion revenue.
- Doesn't provide insights into specific reasons for revenue changes.
- May be affected by pricing changes independent of customer satisfaction.
- Difficult to benchmark across different business models.
- Requires sophisticated revenue tracking systems.
Examples:
- Top SaaS companies like Snowflake and Datadog report NRR above 130%.
- Zoom reported 130%+ NRR during its rapid growth phase.
- Microsoft's cloud services consistently maintain NRR above 120%. These high NRR figures demonstrate the power of focusing on both retention and expansion within an existing customer base.
Tips for Shopify Store Owners and E-commerce Managers:
- Track both GRR and NRR to understand baseline retention and expansion dynamics.
- Segment revenue retention by customer size, industry, or product line to pinpoint areas for improvement. For example, analyze RRR for customers who purchased specific product categories to tailor retention strategies.
- Monitor the ratio of expansion revenue to churn for sustainable growth. Aim for a healthy balance between retaining existing revenue and generating new revenue from your current customers.
- Use cohort analysis to understand how revenue retention evolves over the customer lifetime. This will help you identify critical points where customers tend to churn or upgrade.
- Analyze expansion pathways to identify the most effective upsell opportunities. What complementary products or higher-tier subscriptions resonate most with your existing customers?
- Set different revenue retention targets for different customer segments based on their value and purchasing behavior.
This video further explains the nuances of calculating and interpreting RRR and its importance for sustainable business growth.
Revenue Retention Rate deserves its place in this list of essential customer retention metrics because it goes beyond simple customer counts and directly links retention efforts to financial performance. For Shopify store owners and e-commerce managers, understanding RRR is crucial for building a profitable and sustainable business by maximizing the lifetime value of each customer. By focusing on both retaining existing revenue and identifying expansion opportunities, you can drive consistent growth and build a loyal customer base that contributes significantly to your bottom line.
Customer Retention Metrics Comparison
| Metric | 🔄 Implementation Complexity | ⚡ Resource Requirements | ⭐ Expected Outcomes | 💡 Ideal Use Cases | 📊 Key Advantages |
|---|---|---|---|---|---|
| Customer Retention Rate (CRR) | Low – simple formula & calculation | Low – basic data on customer counts | High – measures customer loyalty & stability | Subscription businesses, all industries | Clear loyalty snapshot, easy calculation, early warning on satisfaction |
| Customer Churn Rate | Low – straightforward inverse metric | Low to Medium – needs churn details and segmentation | High – highlights attrition & revenue impact | SaaS, telecom, subscription models | Direct attrition indicator, KPI for customer loss, forecasts revenue impact |
| Customer Lifetime Value (CLV) | Medium to High – requires aggregated revenue & lifespan data | Medium to High – needs detailed purchase and lifespan info | Very High – informs acquisition/spending strategies | Long-term planning, segmentation, forecasting | Identifies valuable customers, supports acquisition ROI, justifies retention investments |
| Net Promoter Score (NPS) | Low – single survey question | Medium – requires regular surveys | Medium to High – gauges loyalty & sentiment | Customer experience, benchmarking | Simple, high response rates, actionable qualitative feedback, correlates with growth |
| Repeat Purchase Rate (RPR) | Low – simple ratio calculation | Low to Medium – purchase history needed | Medium – shows actual repeat buying behavior | Retail, e-commerce, consumer goods | Direct purchase behavior, signals loyalty, aids cross-sell/up-sell identification |
| Customer Satisfaction Score (CSAT) | Low – simple surveys | Medium – frequent surveys required | Medium – immediate experience feedback | Service interactions, touchpoint evaluation | Quick feedback, easy to implement, identifies improvement areas |
| Revenue Retention Rate | Medium to High – needs revenue tracking systems | High – detailed revenue data including expansions | Very High – combines retention & expansion in revenue terms | Subscription & SaaS businesses | Financially focused, uncovers growth from existing customers, combines retention & upsell insights |
Putting Customer Retention Metrics to Work
Mastering customer retention metrics is crucial for any successful eCommerce business. From understanding your Customer Retention Rate (CRR) and Customer Churn Rate to leveraging the insights provided by Customer Lifetime Value (CLV or LTV) and Net Promoter Score (NPS), these metrics paint a comprehensive picture of your customer relationships. By analyzing metrics like Repeat Purchase Rate (RPR), Customer Satisfaction Score (CSAT), and Revenue Retention Rate, you gain the knowledge needed to optimize your strategies and foster sustainable growth. The key takeaway here is that actively monitoring these seven customer retention metrics empowers you to not only understand who your customers are, but also why they choose to stay—or leave.
This understanding is invaluable. By identifying areas for improvement and implementing targeted retention strategies, you can reduce churn, boost customer loyalty, and ultimately drive greater profitability. These metrics provide the foundation for data-driven decisions that translate directly to your bottom line. Focusing on customer retention doesn't just improve customer relationships; it builds a thriving, customer-centric business poised for long-term success.
Want to personalize customer interactions and automate your retention efforts? Explore how Checkout Links can help you leverage these powerful customer retention metrics by creating personalized checkout experiences that drive repeat purchases and boost customer loyalty. Start optimizing your retention strategies today and unlock the full potential of your Shopify store.