Master the benchmark in marketing: Drive Growth for Your Shopify Store
Picture this: you're driving a car, but the dashboard is blank. No speedometer, no GPS, no fuel gauge. You feel like you're moving fast, but are you breaking the speed limit? Are you even going in the right direction?
That's what running a business without benchmarks is like. A benchmark in marketing is your business's dashboard—it gives you the essential context to understand your performance.
What Is a Benchmark in Marketing Anyway?

Without benchmarks, you're just navigating in the dark. You might be pouring money into ads and sending out email campaigns, but you have no real way of knowing if any of it is actually working. Is your ad spend driving real results, or just burning cash? Are your emails really pulling their weight?
A benchmark in marketing answers these questions. It’s a standard of measurement that transforms abstract data points into concrete, actionable insights. Think of it as your store’s performance dashboard, showing you exactly where you stand.
Gauging Your Performance
Benchmarks give you a critical frame of reference to understand your store's health from a few different angles. They help you size up your performance by comparing your current results against:
- Your Past Performance: Are your sales this month better than last month? Did this year's Black Friday campaign blow last year's out of the water? This is your internal benchmark—your personal best.
- Your Competitors: How does your website’s conversion rate stack up against other stores in your niche? This competitive benchmark shows you where you fit in the market.
- The Industry at Large: Is your email open rate above or below the average for ecommerce? This industry benchmark gives you the big-picture view of your success.
At the end of the day, using a benchmark in marketing is about moving from guesswork to informed, data-driven decisions. By setting these reference points, you can establish realistic goals, pinpoint areas that need a little love, and confidently put your resources into the strategies that will actually grow your Shopify store. It's how you make every single marketing dollar count.
Choosing the Right Benchmarks for Your Store
So, you get what a marketing benchmark is. Great. The next, and arguably most important, step is picking the right one for your store.
Getting this wrong is like training for a marathon when you’re really trying to become a better sprinter. The effort is there, but you're working toward a totally different finish line. The truth is, not all benchmarks serve the same purpose.
For your Shopify store, the trick is to find a reference point that actually matters to your business goals. Are you focused on building a loyal customer base? Trying to finally overtake that one rival? Or simply want to crush your own sales records? Each of these goals requires a completely different kind of benchmark.
Internal Benchmarking: Beating Your Personal Best
The easiest and often most valuable place to start is right at home with internal benchmarking. This is where you compete against yourself. You’re simply measuring your current performance against your own past data to see how far you've come.
Think of it as trying to beat your store's own high score. If your Black Friday campaign last year pulled in $50,000, your internal benchmark for this year is to do better than that. This approach is incredibly powerful because it’s tailored specifically to your unique store, your customers, and your journey.
For a Shopify store, common internal benchmarks might look like:
- Improving on last quarter’s Average Order Value (AOV).
- Increasing your email campaign conversion rate month-over-month.
- Reducing your cart abandonment rate compared to the previous six months. This kind of benchmarking gives you a true apples-to-apples comparison, showing you exactly how you're growing over time.
Competitive and Strategic Benchmarking: Sizing Up the Competition
While beating your own records is essential, you can’t operate in a vacuum. You need to know how you stack up against everyone else. This is where external benchmarks come in, and they generally fall into two camps.
1. Competitive Benchmarking: This is exactly what it sounds like—measuring your store against your direct competitors. We're talking about other stores selling similar products to the same kind of people. For instance, if your conversion rate is holding steady at 1.5%, you'd want to find out if the average for similar stores in your niche is closer to 2.5%. That single piece of data tells you whether you have a massive opportunity for growth or if you're already ahead of the curve.
2. Strategic Benchmarking: This one is a bit more creative. Instead of looking at your direct rivals, you look outside your industry for best-in-class inspiration. You might study a top-tier brand in a completely different field that is famous for something specific, like its incredible customer service or viral marketing campaigns.
For example, a small Shopify apparel store could study a major subscription box company's legendary customer onboarding process. The goal isn't to compare sales figures, but to borrow brilliant ideas to improve its own customer lifetime value. This method is all about learning from the absolute best, helping you find innovative strategies your direct competitors are probably ignoring.
The Essential Ecommerce KPIs You Need to Benchmark
Okay, let's move from theory to practice. A solid benchmark isn't about chasing every vanity metric under the sun. It’s about zeroing in on the Key Performance Indicators (KPIs) that actually move the needle for your business. When you group these KPIs into logical categories, you get a much clearer, more complete picture of your store’s overall health.
This is where the different types of benchmarking—Internal, Competitive, and Strategic—come into play. Each one gives you a unique perspective on your performance data.
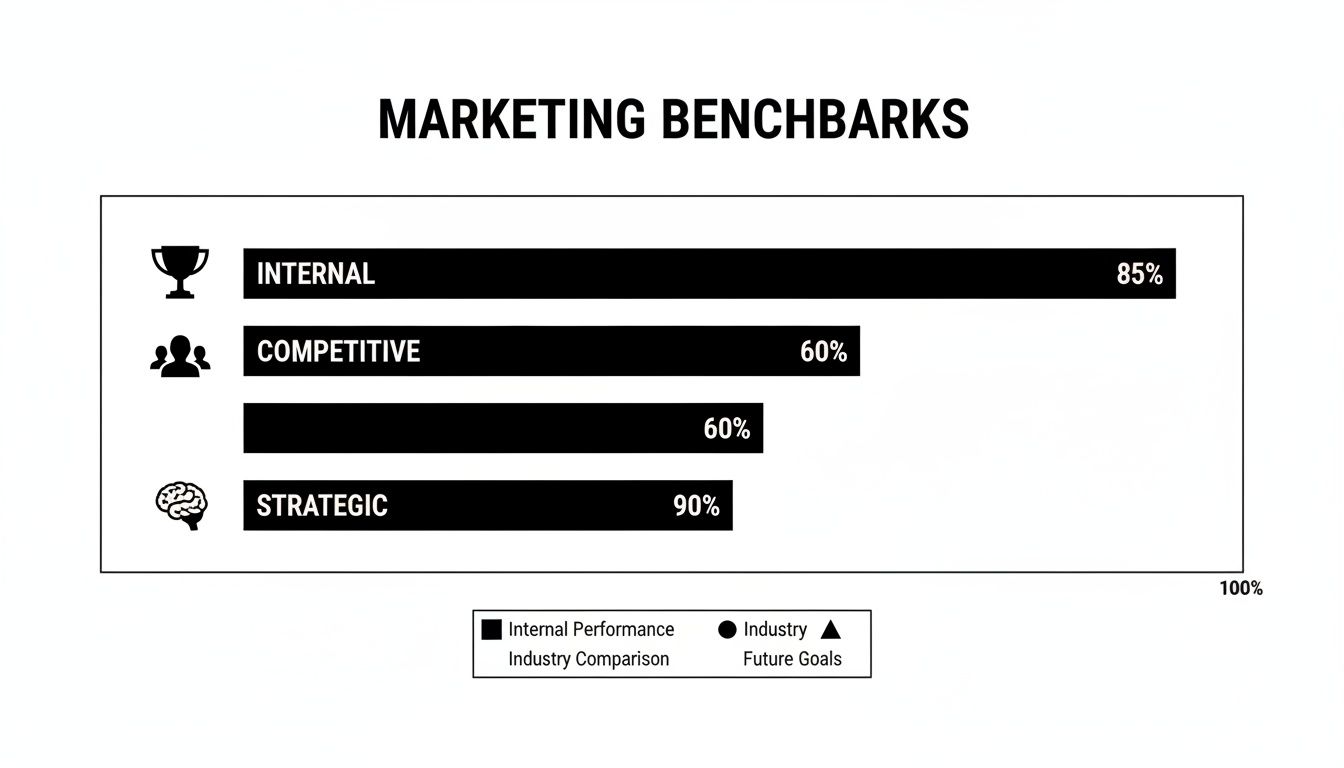
As you can see, you might be outperforming your past self (Internal) but still have room to grow when you look at top-tier competitors (Strategic). It’s all about context.
Website and Conversion Metrics
Think of your website as your digital storefront. Its performance is non-negotiable. These are the KPIs that tell you how good your site is at turning casual browsers into paying customers.
- Conversion Rate: This is the big one—the percentage of visitors who actually complete a purchase. A typical ecommerce conversion rate lands somewhere between 1% and 3%, but don't get too hung up on that number; it varies wildly depending on your industry and price point. A low rate is often a red flag for a clunky checkout or uninspired product pages.
- Average Order Value (AOV): This metric simply tracks the average dollar amount a customer spends per order. Finding ways to increase your AOV is one of the most effective paths to growing revenue without needing a single extra visitor.
- Customer Lifetime Value (CLV): CLV is a forward-looking metric. It estimates the total revenue you can expect from a single customer over the entire course of their relationship with your brand. It’s absolutely vital for understanding long-term profitability and making smart decisions about how much you can afford to spend to acquire a new customer.
Email and Social Media Marketing Metrics
Your direct channels, like email, SMS, and even your social media followers, are your direct lines of communication. Benchmarking their performance is the key to building loyalty and driving those all-important repeat purchases.
Here's a quick reference guide comparing average performance metrics for crucial e-commerce marketing channels.
| Metric | Email Marketing Benchmark | Social Media Ad Benchmark (TikTok) |
|---|---|---|
| Open Rate | ~43.46% (Global Average) | N/A (Focus is on impressions/views) |
| Click-Through Rate (CTR) | ~2.09% (Overall Clicks) | ~1% (Average) |
| Click-to-Open Rate (CTOR) | ~6.81% | N/A |
| Conversion Rate | ~1-5% (Varies by list/offer) | ~0.5-1.5% (Varies by campaign goal) |
These figures, especially the email stats from Dotdigital’s Global Benchmark Report, show just how competitive the inbox is. For Shopify merchants, it means every part of your email—from the subject line to the call-to-action—has to be on point to earn that click. The same goes for your paid social creative.
Paid Advertising Metrics
Paid ads can be a powerful growth engine, but they can also be a money pit. The right KPIs are what help you tell the difference and ensure your ad spend is actually generating a positive return.
Here are the non-negotiables for paid ads:
- Return on Ad Spend (ROAS): This measures the gross revenue you generate for every dollar you spend on advertising. Simple as that. If you spend 100 on ads and get ****500 in sales, your ROAS is 5x.
- Cost Per Acquisition (CPA): This is your total cost to acquire a single new customer from a specific campaign or channel. It answers the question, "How much did it cost me to get that sale?" Beyond these two, digging into understanding Cost Per Acquisition in more detail is a great next step. By keeping a close eye on these KPIs, you can make sure your advertising budget is an investment that works for you, not against you.
How to Set Your First Marketing Benchmarks
Jumping into your first marketing benchmark can feel a bit daunting, but it’s actually more straightforward than you might think. This isn’t about wrestling with complicated spreadsheets or buying fancy software. At its core, it’s about being curious and using the data you already have to make smarter decisions.
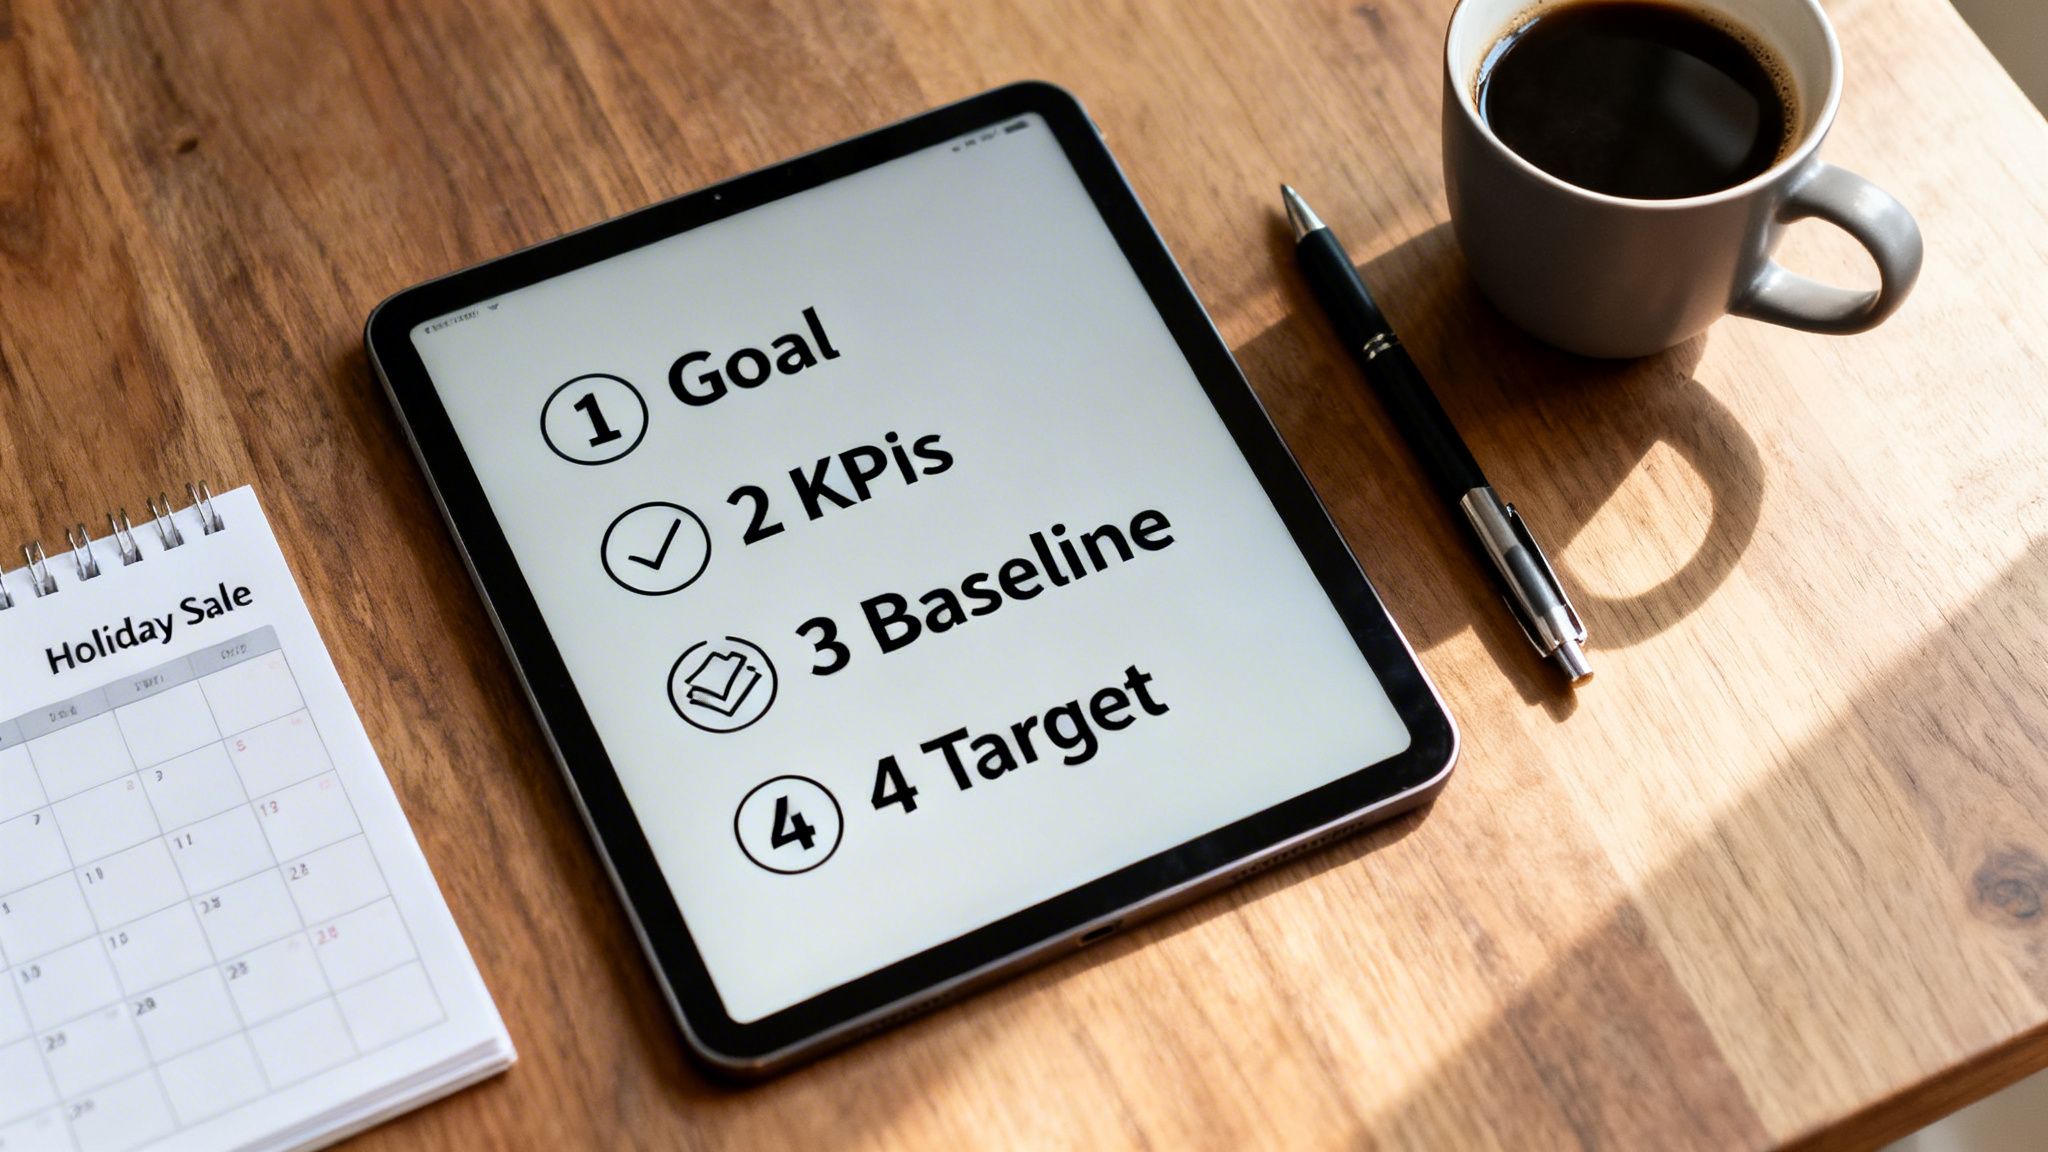
Think of this as your playbook for building benchmarks that actually mean something. Follow these four steps, and you’ll go from guesswork to building a data-backed strategy that can really move the needle.
Step 1: Start with a Clear Business Goal
Before you can measure progress, you have to know where you're going. A vague objective like "get more sales" is a wish, not a goal. To make this work, you need something specific and measurable that ties directly back to a real business outcome.
A solid goal gives your benchmark purpose. It's the North Star that keeps you focused, ensuring every metric you track is actually relevant to what you’re trying to accomplish.
Example Goal: "Increase total revenue from our email marketing campaigns by 20% during the upcoming holiday quarter (Q4)."
Step 2: Identify the Right KPIs
Once your goal is set, the next move is to pick the Key Performance Indicators (KPIs) that will show you whether you're on the right path. Think of these as the vital signs for your goal's health.
For our goal of boosting email revenue, looking at total sales is too broad. We need to dig deeper and track the specific actions that actually lead to that revenue.
Relevant KPIs for our goal would be:
- Email Conversion Rate: Out of everyone who gets the email, what percentage actually buys something?
- Average Order Value (AOV) from Email: When someone does buy, how much are they spending on average?
- Click-Through Rate (CTR): Are people even engaging with our emails and clicking the links inside?
Step 3: Gather Your Baseline Data
Here’s a secret: your best benchmark is your own track record. You need to establish a baseline—a clear picture of where you stand right now. This baseline is your starting point, the number you’ll measure all future efforts against to see if they're actually working.
To get this data, all you have to do is look. Dive into your Shopify Analytics and your email marketing platform. Pull the numbers for the KPIs you just identified over a relevant time frame, like the last quarter or the same holiday period from last year.
Let's imagine you look at last year's Q4 data and find these numbers:
- Email Conversion Rate: 1.8%
- AOV from Email: $85
- CTR: 2.2% These numbers are your baseline. No guesswork involved.
Step 4: Set a Realistic Target
Okay, time to put it all together. You take your big-picture goal and combine it with your hard data to set your final benchmark. This is your specific, time-bound target that you'll work toward.
Your goal was to boost revenue by 20%, so now you can figure out what improvements in your KPIs will get you there. It becomes a simple math problem instead of a wild guess.
Based on the baseline, you might set the following targets for this year's Q4:
- Target Email Conversion Rate: 2.2%
- Target AOV from Email: $95
- Target CTR: 2.5% See how these aren't just random numbers? They're calculated, achievable improvements that directly contribute to that overarching business goal. Just like that, you have a clear, actionable marketing benchmark to guide your entire holiday campaign strategy.
Putting Your Benchmarks to the Test with Checkout Links
https://www.youtube.com/embed/UlnMvZhCOgg
Setting a benchmark in marketing is only half the battle. The real growth kicks in when you start actively testing against it. Think of it this way: a benchmark isn't a finish line you stare at from a distance. It’s a starting block for a series of sprints.
This is where you need the right tools in your corner. Instead of launching a campaign and just hoping for the best, you can design controlled experiments to figure out what actually moves the needle. This active, hands-on approach is what turns your benchmarks from static numbers into dynamic tools for real-world growth.
Designing Precise Marketing Experiments
Let's get practical. Imagine your goal is to beat your current conversion rate benchmark. A classic move is to offer a discount, but the big question is, which one works better? Is it the percentage-off deal or the fixed dollar amount? Guessing is just lighting money on fire.
A much smarter way is to run a clean A/B test. Using a tool like Checkout Links, you can create two separate, trackable links for the exact same product:
- Link A: Sends customers to a cart with a 15% off discount automatically applied.
- Link B: Sends them to the same cart, but with a $10 off discount instead. Now, you can send Link A to one half of your email list and Link B to the other. Or use them in different social media ads targeting similar audiences. Because each link is tracked independently, the results are crystal clear. You'll know for a fact which offer drove more sales, helping you crush your benchmark with a data-backed strategy.
Pinpointing Your Best Performing Channels
This same idea is a game-changer for benchmarking channel performance, especially for tricky areas like influencer marketing or paid social ads. It’s often tough to get accurate tracking from these channels, which makes setting a reliable Return on Ad Spend (ROAS) benchmark feel like a shot in the dark.
Suppose you're collaborating with a new TikTok influencer. Instead of just giving them a generic link to your homepage, create a unique checkout link exclusively for their campaign. You can even bake in a special discount to give their followers an extra nudge to buy.
When you do this, every single sale that comes from that influencer is tied directly back to them. You can see the exact revenue they generated and calculate a precise ROAS for that specific partnership. No more guesswork.
This level of clarity is critical. With global social ad spending projected to top $276.72 billion, knowing which channels are actually delivering is non-negotiable. And when platforms like TikTok can boast an average ROAS of 2.4x, having the tools to measure your own performance lets you double down on what works.
This method helps you establish a solid benchmark in marketing for your influencer program, which you can then stack up against your other channels, like Facebook Ads or Google Shopping. It finally answers that all-important question: "Where is my marketing budget working hardest?" We cover more creative ways to do this in our guide on how to send links for better tracking. Every campaign becomes a valuable lesson, allowing you to systematically fine-tune your strategy and improve performance over time.
Turning Benchmark Data Into Smarter Decisions
You’ve done the hard work of gathering the data and seeing how it stacks up against your benchmark in marketing. But now for the fun part: turning all those numbers into real, actionable intelligence. Data is just noise until you give it meaning, and its true power is unlocked when you use it to make smarter moves.
So, what happens if you miss a target? First off, don’t panic. A single missed benchmark isn't a sign of failure—it's a signal, a flashing light telling you where to look closer. The real question is why it happened.
Did your email open rate tank because of a boring subject line? Or was it a long holiday weekend when your customers were offline? Context is king. A one-day dip in sales is a blip on the radar, but a steady three-month decline is a trend that needs your full attention.
Embracing Continuous Improvement
The brands that consistently win treat benchmarking less like a final report card and more like a continuous, living process. Think of it as a simple but powerful loop:
- Measure: Keep a close, consistent eye on your KPIs.
- Analyze: Compare your results to your benchmark and dig into the story behind the numbers.
- Adjust: Based on your analysis, form a hypothesis about what could work better and test that change.
- Repeat: Measure the results of your tweak and begin the cycle all over again. Following this loop turns your marketing from a set of disconnected campaigns into a dynamic strategy that gets sharper and more effective over time.
Adopting this mindset is how you ensure your marketing is always getting better. Of course, this all hinges on having clean, reliable data from the start. Perfecting your campaign links is fundamental, and you can learn more by exploring our guide on UTM tracking best practices.
Common Questions About Marketing Benchmarks
Even with a solid plan, it's normal to have questions about using benchmarks in your marketing. Let's walk through a few of the most common ones so you can feel more confident navigating your data.
How Often Should I Review My Benchmarks?
The honest answer? It really depends on what you're measuring. If you're running fast-paced paid ad campaigns on social media, you’ll want to be checking in daily or at least weekly. This lets you tweak your spending and creative on the fly to get the best results.
But for bigger picture metrics, like Customer Lifetime Value (CLV) or your overall website conversion rate, a monthly or quarterly check-in is a much smarter approach. This cadence allows you to spot actual trends instead of overreacting to the small, everyday ups and downs. Consistency is what matters most.
What Is the Difference Between a Benchmark and a KPI?
This is a really important one to get right, and it trips a lot of people up. Let’s use a road trip analogy to make it clear:
- A KPI (Key Performance Indicator) is like your car's speedometer. It tells you your current speed—it's the thing you are actively measuring, like your email open rate.
- A benchmark is the speed limit on the road. It's the standard you're comparing yourself against, like the industry average email open rate of 2.5%. You need KPIs to see what you're doing, but you need benchmarks to understand if what you're doing is actually good. One without the other is just a number floating in space without any context.
Where Can I Find Reliable Competitive Benchmark Data?
Getting your hands on precise competitor data can be tricky, but it's not impossible. Your best bet is to look for industry reports from major marketing platforms. Companies like Dotdigital or Klaviyo often publish fantastic reports based on aggregated, anonymized data from thousands of businesses.
You can also use tools like SEMrush to get a peek into a competitor's web traffic and advertising playbook. That said, always, always start by benchmarking against yourself. Your own historical data is the most reliable starting point you have before you start comparing yourself to the wider industry.
Ready to stop guessing and start measuring? With Checkout Links, you can create trackable links for A/B tests, influencer campaigns, and more to set and beat your marketing benchmarks. Create your first trackable link in seconds.