Ecommerce Performance Metrics A Shopify Store Owner's Guide
Think of ecommerce metrics as your store's health report. They're the specific numbers—like your conversion rate or average order value—that tell you exactly what's working, what's broken, and where your biggest opportunities are hiding.
Why Your Store Needs Performance Metrics
Trying to run an online store without tracking these numbers is like flying a plane blindfolded. Sure, you're in the air, but are you climbing towards your destination or heading for a nosedive? Metrics give you the instruments to make smart, data-driven decisions instead of just guessing and hoping for the best.
The online world is more crowded than ever. Global ecommerce sales are expected to hit a massive $7.4 trillion by 2025, which is nearly 24% of all retail spending. With over 2.77 billion people shopping online, you need a sharp understanding of your own performance to stand out. You can dig deeper into these online retail trends and statistics to get the full picture.
Moving Beyond Vanity Metrics
It's easy to get distracted by vanity metrics. These are the flashy numbers that feel good but don’t actually tell you much about your business's health—things like social media likes, page views, or your total number of email subscribers. They might boost your ego, but they don't directly pay the bills.
The real magic is in the actionable metrics. These are the numbers that give you clear insights you can actually do something with. They answer the big questions:
- Is my marketing actually working? (Customer Acquisition Cost, Return on Ad Spend)
- Are people who visit my site actually buying? (Conversion Rate, Cart Abandonment Rate)
- Is this business built to last? (Customer Lifetime Value, Repeat Purchase Rate)
Let's quickly look at the key metrics we'll be breaking down in this guide. This table gives you a snapshot of what each one is and why it's so important for growing your business.
Key Ecommerce Metrics At a Glance
| Metric | What It Measures | Why It Matters for Growth |
|---|---|---|
| Conversion Rate | The percentage of visitors who make a purchase. | Reveals the effectiveness of your site and marketing in turning browsers into buyers. |
| Average Order Value (AOV) | The average amount customers spend in a single transaction. | Increasing AOV is a direct path to boosting revenue without needing more traffic. |
| Customer Lifetime Value (CLTV) | The total revenue a single customer is predicted to generate over time. | Helps you understand customer loyalty and how much you can afford to spend on acquisition. |
| Customer Acquisition Cost (CAC) | The total cost of acquiring a new customer. | Tells you if your marketing spend is profitable and sustainable. |
| Return on Ad Spend (ROAS) | The revenue generated for every dollar spent on advertising. | Measures the direct profitability and performance of your ad campaigns. |
| Cart Abandonment Rate | The percentage of shoppers who add items to their cart but leave without buying. | Highlights friction in your checkout process and uncovers lost revenue opportunities. |
| Revenue Per Visitor (RPV) | The average revenue generated from each unique visitor to your site. | Provides a holistic view of your store's ability to monetize traffic. |
| Repeat Purchase Rate | The percentage of customers who have made more than one purchase. | A key indicator of customer satisfaction, loyalty, and product-market fit. |
| Customer Retention Rate | The percentage of existing customers who continue to buy from you over a period. | Shows your ability to build long-term relationships, which are far more profitable. |
| Funnel Metrics | The step-by-step conversion rates through your sales funnel. | Pinpoints exactly where customers are dropping off in the buying journey. |
Throughout this guide, we’ll dive deep into each of these metrics for your Shopify store. We'll show you how to calculate them, what they really mean for your bottom line, and most importantly, how to actually improve them. This framework will help you turn confusing data into a clear roadmap for growing a healthier, more profitable business.
The Four Core Metrics That Drive Revenue
You could track dozens of ecommerce metrics, but honestly, only a handful truly matter for your store's bottom line. These four are the foundation of your profitability. They don't just measure what's happening; they actively control your revenue and give you a real-time pulse on the health of your business. If you can get a handle on these, you're on your way to building an online store that lasts.
Think of it like this: if your store were a car, these four metrics are what keep the engine running. Conversion Rate is your fuel efficiency. Average Order Value is your horsepower. Customer Lifetime Value is the engine's lifespan, and Customer Acquisition Cost is what you pay for the fuel. They all have to work together for the whole system to perform.
This map does a great job of showing the difference between vanity metrics (the ones that feel good) and the metrics that actually build a business.
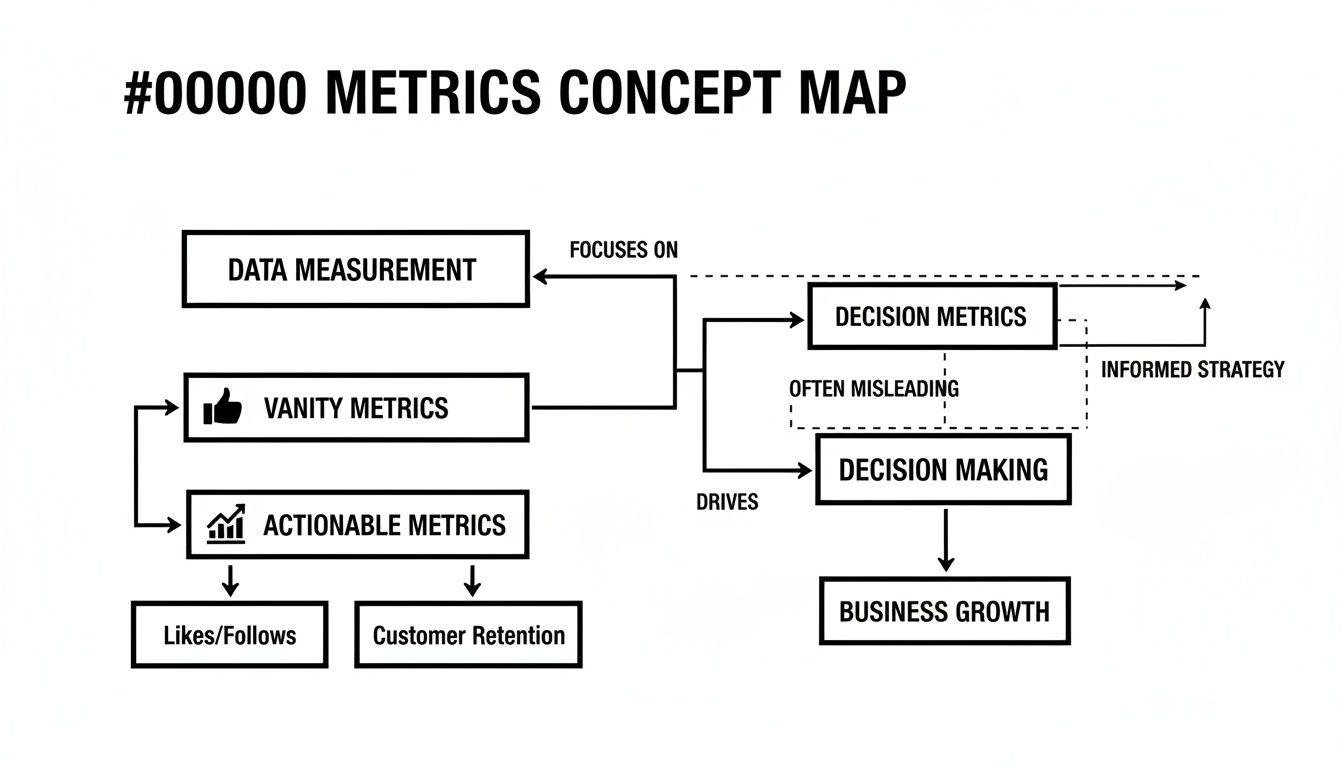
The big idea here is to stop obsessing over passive numbers like social media likes and start focusing on the actionable metrics that put money in the bank.
Conversion Rate: Your Power of Persuasion
Conversion Rate (CR) is the metric everyone talks about, and for good reason. It’s simply the percentage of your website visitors who end up buying something. This number is the ultimate report card on how well your entire store experience works—from your ads and product pages to your checkout flow.
- Formula: (Number of Sales / Number of Visitors) x 100 = Conversion Rate (%)
- What It Tells You: A high conversion rate means your products, pricing, and user experience are all clicking with customers. A low rate is a red flag that something is causing friction. It could be anything from confusing navigation and bad product photos to a clunky checkout. As of 2024, the global average ecommerce conversion rate is hovering somewhere between 2.5% and 3%. It's a tough, competitive world out there. If you're on Shopify, you might see a lower average of around 1.4%, but that figure includes tons of new stores that are still figuring things out. The top performers on the platform are hitting 3.2% and higher.
Average Order Value: The Size of the Sale
Next up is Average Order Value (AOV). This metric tells you how much the average customer spends in a single transaction. Pushing your AOV higher is one of the smartest ways to grow revenue because you're getting more from the customers you already have instead of constantly paying to find new ones.
- Formula: Total Revenue / Number of Orders = Average Order Value ($)
- What It Tells You: Your AOV is a direct reflection of how well your pricing, upselling, and cross-selling strategies are working. If that number isn't moving, you’re likely leaving money on the table with every sale.
Customer Lifetime Value: The Long-Term Relationship
Customer Lifetime Value (CLTV) is where you shift from thinking about a single sale to the entire relationship with a customer. It predicts the total profit you can expect to make from an individual over the entire time they shop with you. This is a game-changer for making smart decisions on how much you should really spend on marketing, customer service, and keeping people around.
- Formula: (Average Order Value x Average Purchase Frequency) x Average Customer Lifespan = CLTV
- What It Tells You: A high CLTV is proof of strong customer loyalty and satisfaction. It means you’ve built a brand that people trust and return to, not just a one-and-done store.
Customer Acquisition Cost: The Price of Growth
Finally, we have Customer Acquisition Cost (CAC). This is the total amount you spend on sales and marketing to get one new customer. It’s the cost of doing business online, covering everything from your ad spend on Meta and Google to the salaries of your marketing team.
- Formula: Total Sales & Marketing Costs / Number of New Customers Acquired = CAC
- What It Tells You: This number tells you if your growth is profitable and sustainable. If your CAC is higher than your AOV, you're losing money on the first sale. Even worse, if it's higher than your CLTV, your entire business model is in trouble. To get a clear picture of your ad performance, you need to be able to accurately calculate your Cost Per Acquisition (CPA). When you look at these four core metrics together, they tell the complete financial story of your business—from what it costs to earn a customer to the total value they bring you over time.
Finding the Leaks in Your Sales Funnel
Your sales funnel isn't a perfect, sealed pipe. It’s more like a garden hose with tiny, invisible leaks. Every visitor who drops off before buying is one of those leaks, and a few key e-commerce metrics are the perfect tools for finding them.
By focusing on these diagnostic KPIs, you can pinpoint exactly where you’re losing potential customers and start patching the holes. Think of metrics like Cart Abandonment Rate, Return on Ad Spend (ROAS), and Revenue Per Visitor (RPV) as your pressure gauges. A sudden drop in one area tells you precisely where the problem is. To get a better sense of what a healthy funnel looks like, it’s always helpful to review some practical digital sales funnel examples and see how successful brands map out their customer journeys.
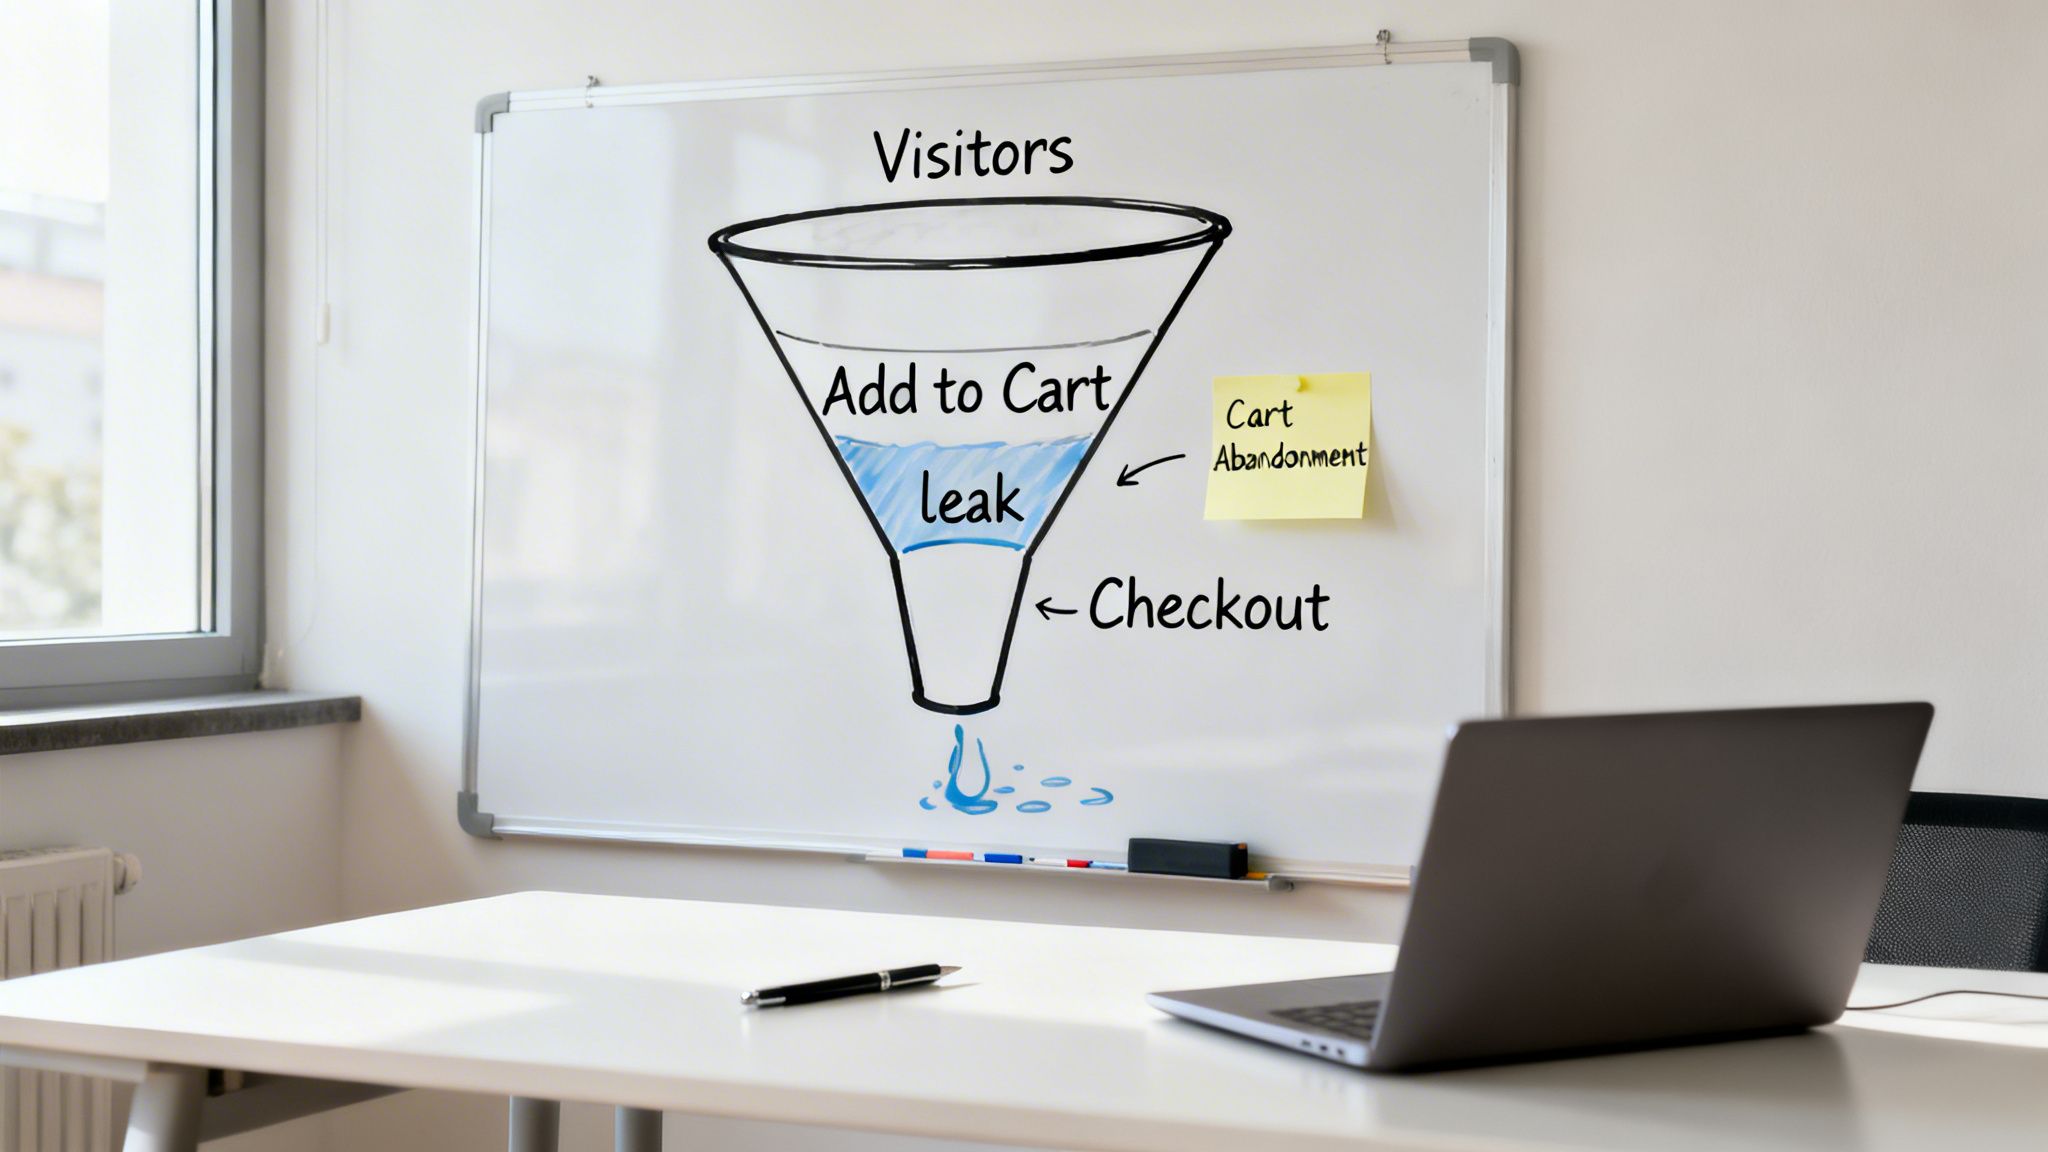
Uncovering Friction With Cart Abandonment Rate
The Cart Abandonment Rate is one of the most revealing metrics you can track. It measures the percentage of shoppers who put items in their cart but then bounce without actually buying anything. These aren't just casual browsers; these are people who showed a clear intent to buy, but something stopped them in their tracks.
- Formula: (1 - [Number of Completed Purchases / Number of Carts Created]) x 100 = Cart Abandonment Rate (%)
- What It Tells You: A high rate is a massive red flag that there's friction in your checkout process. You’ve done the hard work of getting them to your site and convincing them to add a product, only to lose them at the very last step. The numbers here are staggering. Industry-wide, e-commerce cart abandonment rates have crept above 70%. The number one culprit? Unexpected costs like shipping, taxes, and hidden fees. Speed is a close second. Sites that load in just one second have conversion rates three times higher than slower sites, proving that every moment of delay costs you real money.
Measuring Ad Efficiency With ROAS
While cart abandonment diagnoses the end of your funnel, Return on Ad Spend (ROAS) looks right at the beginning. It tells you exactly how much revenue you’re generating for every single dollar you spend on advertising. It’s the ultimate measure of whether your ad budget is a smart investment or just a sunk cost.
Formula: Total Revenue from Ads / Total Ad Spend = ROAS
What It Tells You: A low ROAS (say, 1:1) means you're just breaking even on ad costs, which is not a sustainable way to grow. On the other hand, a high ROAS (like 4:1 or more) is a clear sign your campaigns are profitable and hitting the right audience. If your ROAS is poor, you’ve got a leak at the top of your funnel. This usually points to one of a few problems:
Weak Ad Creative: Your ads simply aren't compelling enough to attract qualified buyers.
Poor Audience Targeting: You're showing your ads to people who have no interest in what you sell.
Ineffective Landing Pages: The page visitors land on after clicking your ad doesn't match their expectations or persuade them to stick around.
Judging Overall Funnel Health With RPV
Finally, Revenue Per Visitor (RPV) gives you a holistic view of your entire funnel's performance. It calculates the average amount of money generated by each unique person who lands on your site, whether they buy something or not. This metric beautifully connects your traffic acquisition efforts with your site's actual ability to convert that traffic into cash.
- Formula: Total Revenue / Total Unique Visitors = RPV
- What It Tells You: RPV is great because it balances both your conversion rate and your average order value. For instance, you could have a low conversion rate but a really high AOV, which could still result in a healthy RPV. It helps you understand the true monetary value of your website traffic. If your RPV is low, it means you have a monetization problem. You might be attracting a lot of traffic (a high visitor count) that isn't converting well or isn't spending much when it does. This diagnostic metric tells you to start optimizing the entire customer journey—from the first ad click to the final purchase confirmation—to make sure every visitor has the maximum potential to generate revenue.
Measuring Loyalty With Customer Retention Metrics
Getting new customers is exciting, but the real secret to a healthy, profitable ecommerce business is keeping the customers you already have. After all, it can cost up to five times more to attract a new customer than to keep an existing one happy.
This is where loyalty metrics come in. They shift your focus from simply making sales to building genuine, long-term relationships. These numbers tell you how well you’re creating a loyal fan base that generates predictable, recurring revenue—the true sign of a strong brand.
Repeat Purchase Rate
Your Repeat Purchase Rate (RPR) is one of the most straightforward and telling metrics you can track. It simply shows you what percentage of your customers have come back to buy from you again. Think of it as a clear signal of that initial "wow" factor and a solid product-market fit.
A high RPR means your products, your service, and the whole shopping experience were good enough to make someone say, "I'm coming back."
- Formula: (Number of Customers with More Than One Purchase / Total Number of Customers) x 100 = Repeat Purchase Rate (%)
- What It Tells You: This metric gets right to the point: are you turning one-time buyers into repeat business? If your RPR is low, it might be a red flag. Customers aren't seeing enough value to return, which could point to issues with product quality, shipping, or your post-purchase communication.
Customer Retention Rate
While it sounds similar to RPR, the Customer Retention Rate (CRR) gives you a different, more long-term view. It measures the percentage of customers who stick with you over a specific time frame, like a quarter or a full year. It’s less about that second purchase and more about ongoing loyalty.
Put it this way: RPR tells you if they came back once. CRR tells you if they're staying for the long haul.
- Formula: (([Number of Customers at End of Period - Number of New Customers Acquired] / Number of Customers at Start of Period)) x 100 = Customer Retention Rate (%)
- What It Tells You: A healthy CRR is the foundation for a high Customer Lifetime Value (CLTV). It’s proof that you’re building relationships, not just processing transactions. While it’s absolutely critical for subscription businesses, it's just as important for any store that wants to grow sustainably. For a deeper look, check out our guide on essential customer retention metrics and how to improve them.
How to Improve Your Retention Metrics
Boosting retention isn’t about a huge budget—it’s about a deliberate focus on what happens after the sale. The post-purchase experience is where loyalty is truly won or lost.
Here are a few proven ways to encourage customers to stick around:
- Launch a Loyalty Program: Reward repeat customers with points, discounts, or exclusive access. Even a simple tiered program can make people feel appreciated and give them a great reason to shop with you instead of a competitor.
- Send Personalized Follow-Up Emails: Move beyond the generic "thanks for your order" email. Send product recommendations based on what they've bought before, include a small discount for their next purchase, or share useful content that helps them get more out of their new item.
- Create Exclusive Offers for Existing Customers: Treat your loyal customers like VIPs. Give them early access to new products, create special bundles just for them, or run members-only sales. This creates a sense of community and exclusivity that people love.
How To Build Your Ecommerce Metrics Dashboard
Gathering data is one thing, but turning that flood of information into something you can actually use is a totally different ballgame. This is where a well-built ecommerce dashboard comes in. It’s your command center, cutting through the noise to give you a clear, single view of your business health.
Think of it like this: you could have a pile of car parts in your garage, but that won't get you anywhere. It's only when they're assembled into a dashboard that you get real-time feedback on your speed, fuel, and engine status. Your ecommerce dashboard does the exact same thing for your store's performance.

Organizing Your Dashboard By Timeframe
Not all metrics are created equal, and you definitely don't need to check them all with the same frequency. Some are your daily pulse check, while others are more like a quarterly check-up with the doctor. By organizing your dashboard into daily, weekly, and monthly views, you can avoid panicking over tiny, insignificant dips while still keeping a close watch on the trends that truly matter.
Here's a simple, practical way to think about structuring your dashboard.
Your Ecommerce Dashboard Structure
This table lays out a solid framework for monitoring the right metrics at the right time, helping you focus your energy where it will have the most impact.
| Tracking Frequency | Primary Metrics To Monitor | Key Question This Answers |
|---|---|---|
| Daily | Website Traffic, Conversion Rate, Revenue, Ad Spend | Is the store healthy right now? Did anything just break? |
| Weekly | Cart Abandonment, ROAS, CAC, AOV | Are our marketing efforts paying off? How is the sales funnel performing? |
| Monthly/Quarterly | CLTV, Repeat Purchase Rate, Retention Rate | Are we building a sustainable business? Are customers coming back? |
This kind of structure brings discipline to your analysis, making it far more efficient and a lot less overwhelming.
The Power of Segmenting Your Data
Looking at your overall metrics is a fine starting point, but the real gold is found when you start segmenting. Segmentation is just a fancy word for breaking down your data into smaller, more specific groups to see how they behave differently.
It’s how you discover that while your store’s overall conversion rate is 2%, your mobile conversion rate is a painful 0.8%. All of a sudden, you don’t have a vague "conversion problem"—you have a very specific mobile user experience problem you can solve.
To get started, focus on these three critical segments:
- Traffic Source: How do visitors from Google Ads compare to those from Instagram or your email list? You might find one channel brings in tons of traffic but almost no sales, telling you it’s time to adjust your messaging or targeting for that audience.
- Device Type: Look at your metrics for desktop versus mobile. If 70% of your traffic comes from mobile but only accounts for 30% of your revenue, you've just uncovered a massive friction point in your mobile checkout process that needs fixing—fast.
- Customer Segment: Split your data between new and returning customers. This is crucial for understanding loyalty. For instance, if you see a much higher AOV from returning customers, it's a great sign that your upselling and cross-selling strategies are working with your most valuable audience.
Finding Your Data In Shopify and Google Analytics
To build this complete picture, you’ll need to pull information from a couple of key places. Both Shopify Analytics and Google Analytics are treasure troves of data that, when combined, give you a powerful view of your business.
In Shopify Analytics
Shopify’s native dashboard is your go-to for all the core numbers directly tied to sales. Just navigate to your Analytics > Dashboards section, and you’ll find these metrics ready to go:
- Total Sales and Revenue
- Conversion Rate (specifically, your online store conversion rate)
- Average Order Value (AOV)
- Returning Customer Rate If you need to dig even deeper, there are plenty of powerful Shopify analytics tools that can provide more advanced insights.
In Google Analytics 4 (GA4)
GA4 is where you go to understand how people behave on your site and where they came from. Here's where to find the data for those critical segments:
- Traffic Source: Go to Reports > Acquisition > Traffic acquisition. This report shows you exactly which channels are driving users and, more importantly, conversions.
- Device Type: Head to Reports > Tech > Tech details. From there, change the primary dimension to "Device category" to see a clean comparison of your desktop, mobile, and tablet performance. By marrying the hard sales data from Shopify with the rich behavioral data from Google Analytics, you can build a dashboard that tells the full story of what's happening in your store and why.
Turning Your Insights Into Sustainable Growth
https://www.youtube.com/embed/BypkCVmzJ7E
Throughout this guide, we've broken down the key ecommerce metrics that tell you what's really going on inside your business. Think of them as the vital signs of your store's health—they help you diagnose problems, spot opportunities, and write the next chapter of your growth story.
The main plot points are always revealed by a few key players: Conversion Rate (CR), Average Order Value (AOV), Customer Lifetime Value (CLTV), Customer Acquisition Cost (CAC), and Cart Abandonment Rate. Getting a handle on these isn't about rote memorization. It’s about learning to interpret the story they tell you about your customers' behavior.
Real improvement isn’t a one-and-done project. It’s a constant loop of tracking your numbers, digging into what they mean, and then testing new ideas to see what moves the needle.
From Data to Decisions
The real magic happens when you let these metrics guide your strategy. It’s the difference between guessing and knowing.
Instead of just wondering why sales dipped last month, you can actually see that your cart abandonment spiked right after you changed the shipping options, or that the ROAS from a specific Facebook campaign tanked. This kind of clarity is what separates the stores that consistently grow from the ones that just tread water.
This process shifts you from being a reactive business owner, constantly putting out fires, to a proactive strategist. You start anticipating challenges, doubling down on what’s working, and ultimately building a much more resilient business.
Your Starting Point for Growth
It's easy to feel overwhelmed by all the data. The good news is you don't have to fix everything at once. The key is to start small and be disciplined.
Pick just one or two metrics that matter most right now. Is traffic high but your conversion rate is in the gutter? Then Conversion Rate is your obsession. Are you profitable but the margins are razor-thin? Zero in on increasing your AOV or driving down your CAC.
By focusing your effort, you start turning abstract numbers into tangible results. This is how you build real, lasting growth for your Shopify store.
Frequently Asked Questions
Diving into ecommerce metrics can feel like a lot, especially when you're just trying to get your business off the ground. Let's clear up some of the most common questions we hear from Shopify owners.
What Are The Most Important Metrics For A New Shopify Store?
When you’re just starting out, your main goal is simply to prove that your idea works. You can (and should) ignore the fancy, complex metrics for now and just nail the fundamentals.
Get laser-focused on these three:
- Conversion Rate: This is your north star. It’s the ultimate validation that people who land on your site actually want what you're selling.
- Customer Acquisition Cost (CAC): You have to know if you can get customers without going broke. If your CAC is sky-high from the beginning, the business model just isn't sustainable.
- Cart Abandonment Rate: Think of this as your early warning system. A high number here is a massive red flag, pointing directly to a major problem on your product pages or in the checkout itself that needs to be fixed, fast. Once you have a good handle on these, you’ll have a solid foundation to build on. Then you can start worrying about optimizing the more advanced stuff like Customer Lifetime Value.
How Often Should I Check My Ecommerce Metrics?
This really depends on the metric and what you're trying to learn from it. Obsessively checking everything every single day is a recipe for stress and making bad, knee-jerk decisions.
A better way to approach it is to group your metrics by cadence:
- Daily or Weekly: Keep an eye on the vital signs of your store—things like site traffic, revenue, and conversion rate. This helps you spot immediate issues, like a broken promo code or an ad campaign that's suddenly tanking.
- Weekly: Dig into metrics that show how your marketing is performing, like ROAS, AOV, and CAC. A week's worth of data is usually enough to give you a clear picture of what's working without getting lost in daily noise.
- Quarterly: This is the time to look at the big picture with strategic metrics like Customer Lifetime Value (CLTV) and Customer Retention Rate. These numbers don't change overnight, but they tell you the long-term story about your brand's health and how much your customers love you.
My Conversion Rate Is Low. What Should I Fix First?
A low conversion rate almost always points to problems in two key places: your product pages and your checkout process. These are the make-or-break moments where a potential customer decides to pull the trigger or walk away.
Start by putting yourself in your customers' shoes. Are your product photos clear, compelling, and professional? Does your copy actually persuade someone to buy, and is the pricing easy to understand?
Ready to turn more clicks into customers? Checkout Links lets you create and share personalized checkout links that bypass the cart, making it easier for customers to buy instantly from your emails, social posts, or ads. Start streamlining your sales process today.