Mastering Email Marketing Metrics for Real Growth
Think of email marketing metrics as the vital signs for your campaigns. They're the specific data points that tell you exactly how your emails are performing, from the moment they land in an inbox to the final click that leads to a sale. These numbers provide the critical insights you need to understand what's working, what's not, and how much money you're actually making.
Your Campaign's Compass: Why Metrics Matter
Trying to run an email marketing strategy without tracking metrics is like sailing a ship without a compass. Sure, you're moving, but are you heading toward your destination or drifting straight into a storm? Email marketing metrics are those navigational tools, giving you the hard data needed to steer your strategy in the right direction.
Without them, you're just guessing. You have no real idea which subject lines grab attention, what kind of content your audience actually enjoys, or if all your effort is translating into revenue. This guesswork leads to wasted time and money, missed opportunities, and—worst of all—emails that get ignored or flagged as spam.
The Power of Data-Driven Decisions
When you start paying attention to the right numbers, email transforms from a simple broadcast medium into a powerful, responsive, and revenue-generating machine. It allows you to "listen" to your audience by observing their actions.
It really breaks down like this:
- Diagnose Campaign Health: Just like a doctor checks your pulse and blood pressure, metrics like deliverability and open rates tell you if your email program is fundamentally healthy.
- Understand Your Audience: Click-through rates and conversion data show you what your subscribers actually care about, helping you move beyond assumptions and create content they genuinely want.
- Prove Your ROI: When you track revenue-focused metrics, you can draw a straight line from your email campaigns to your company's bottom line, proving email's value to anyone who asks.
Before we dive into specific metrics, it's helpful to understand how they're grouped. Different metrics tell different parts of your campaign's story, from initial engagement to long-term value.
Core Metric Categories at a Glance
| Metric Category | What It Measures | Example Metrics |
|---|---|---|
| Engagement Metrics | How subscribers interact with your emails. | Open Rate, Click-Through Rate |
| Health & Deliverability | The technical success of reaching the inbox. | Bounce Rate, Unsubscribe Rate |
| Conversion & ROI | The financial impact of your campaigns. | Conversion Rate, Revenue Per Email |
| Subscriber Health | The overall quality and growth of your list. | List Growth Rate, Churn Rate |
This table gives you a bird's-eye view. As we go through this guide, we'll break down each of these categories and the specific metrics within them, showing you how to track and improve each one.
The sheer scale of email today makes this all the more important. By 2025, the number of global email users is set to hit nearly 4.5 billion, with projections showing continued growth. A huge chunk of these users check their inbox multiple times a day, making email a direct and reliable channel to your customers. You can learn more about these email engagement trends and how they impact marketers.
Ultimately, a commitment to a data-first approach is what separates the most successful campaigns from the ones that fall flat. To get started, you can explore our complete guide on how to implement data-driven email marketing. It’s your first step toward turning raw numbers into real results.
Decoding Clicks, Opens, and True Engagement

Alright, so your email made it past the spam filters and landed safely in the inbox. That's a great start, but the real work has just begun. Now we need to ask the important questions: Did anyone even notice it? Did they open it? And, crucially, did they do anything?
This is where we move beyond delivery and into the heart of engagement. Think of it like this: getting an email delivered is like setting up a shop on a busy street. But you still need to know how many people glanced in your window, how many actually walked inside, and who ended up making a purchase. To tell that story, we rely on three foundational metrics: Open Rate, Click-Through Rate (CTR), and Click-to-Open Rate (CTOR).
The Story of the Open Rate
For years, the Open Rate was the headline act. It's simply the percentage of people who opened your email. A high open rate was a clear sign that your subject line and preheader text hit the mark, cutting through the inbox clutter to grab someone's attention.
But things have changed. With the rollout of Apple’s Mail Privacy Protection (MPP), the open rate has become a bit of a vanity metric. MPP can preload email content in the background, marking many emails as "opened" even when the recipient never laid eyes on them. This can seriously inflate your numbers, making it a shaky foundation for measuring genuine interest.
So, should you ignore it completely? Not quite. It's still useful for spotting broad trends. A sudden, dramatic drop might still point to an issue with your sender reputation or subject lines that are falling flat. Just don't treat it as gospel anymore.
The Click-Through Rate: A Measure of Action
This is why we now lean more heavily on the Click-Through Rate (CTR). This metric tracks the percentage of your total recipients who clicked on at least one link inside your email. CTR is a much more honest signal of engagement because it requires a conscious action from your subscriber. They didn't just open the email—they found something inside compelling enough to click.
Let's play out a common scenario. You send an email with a killer subject line: "50% Off Everything—Today Only!" You're thrilled to see a massive 45% open rate. Success! But then you check the CTR, and it's a measly 0.5%. What gives?
This tells a very clear story:
- What worked: Your subject line was a masterpiece of urgency and curiosity.
- What failed: The content inside the email—the design, the copy, or the call-to-action (CTA)—didn't deliver on that initial promise. A low CTR, especially when you have a high open rate, is your cue to look inward and rethink the body of your emails.
CTOR: The Ultimate Test of Content Quality
To get the sharpest picture of how your content is performing, we turn to the Click-to-Open Rate (CTOR). This metric isolates the people who actually opened your email and then calculates what percentage of that group clicked a link. It cuts through the noise of inflated opens (thanks, MPP!) and focuses squarely on your engaged audience.
Let’s go back to our 50% off sale. The high open rate was misleading, but the CTOR gives you a precise diagnosis. It tells you exactly how well your message resonated with the people who were truly listening. An average CTOR hovers around 10% across most industries, but this can certainly vary.
Here’s a quick rundown of how these three metrics work together:
| Metric | What It Tells You | How to Improve It |
|---|---|---|
| Open Rate | Initial interest in your subject line and sender name. | A/B test subject lines, use personalization, and send from a recognizable name. |
| CTR | Overall effectiveness at driving action from your entire list. | Improve CTA visibility, strengthen your offer, and ensure mobile-friendly design. |
| CTOR | The quality and relevance of your email content for engaged subscribers. | Enhance your copy, use compelling visuals, and make sure your CTA aligns with the subject line's promise. |
By analyzing CTR and CTOR in tandem, you get a much deeper understanding of your campaign's performance. You can pinpoint whether you're losing people at the "attention-grabbing" stage (the subject line) or the "action-driving" stage (the email content). This is the kind of focused insight that leads to real improvements and helps turn subscribers into loyal customers.
Gauging Your List Health and Deliverability
You can craft the most brilliant email with an offer nobody could refuse, but it's completely worthless if it never actually reaches the inbox. Before you can even start worrying about opens and clicks, you have to master deliverability—the art and science of getting your message past the gatekeepers and into your subscribers' primary folders.
Think of it like sending a package. A fantastic product inside doesn't matter much if you've got the wrong address or the shipping label is unreadable. These foundational email marketing metrics are all about making sure your delivery service is running smoothly. We'll start with the three core indicators of your list's health: Bounce Rate, Unsubscribe Rate, and Spam Complaint Rate.
Decoding Bounced Emails
Your Bounce Rate is simply the percentage of your emails that, for whatever reason, couldn't be delivered. And just like mail getting returned to the sender, there are a couple of different reasons this happens. We split them into two types.
- Hard Bounces: This is the equivalent of a "no such address" stamp from the post office. A hard bounce means the email address is permanently invalid, maybe because of a typo during signup or the account was deleted long ago. These addresses are dead weight and should be scrubbed from your list immediately.
- Soft Bounces: Think of this as a temporary delivery problem. Maybe the recipient's mailbox is crammed full, or their company's email server is down for maintenance. Your email service provider will usually try to send it again a few times before giving up. A healthy bounce rate should always be under 2%. If you see that number start to creep up, it’s a big red flag. It could mean there's a problem with how you're collecting emails or that your list is getting stale and needs a good cleaning.
Reframing Your Unsubscribe Rate
It’s easy to take it personally when someone unsubscribes, but you have to shift your perspective on this one. The Unsubscribe Rate isn't a failure—it's actually a sign of a healthy, self-cleaning email list. When someone opts out, they're doing you a favor.
Why is it a good thing? Because it ensures you're only talking to people who actually want to hear from you, which naturally boosts engagement with the subscribers who stick around. An ideal unsubscribe rate sits below 0.2%. If you see a sudden spike, that's your cue to figure out if your content has drifted away from what your audience expects.
Focusing on the right audience keeps you from wasting time and money on people who will never convert. More importantly, it protects your reputation with the big email providers.
The Dangers of Spam Complaints
Of all the metrics here, the Spam Complaint Rate is the one you need to watch like a hawk. This isn't just someone quietly leaving; this is a recipient actively hitting the "Spam" button on your email. This sends a direct, negative signal to providers like Gmail and Outlook that your content is unwanted junk.
Even a tiny spam complaint rate can wreck your sender reputation. Anything above 0.1% is considered dangerously high. If that number gets out of control, email providers will start sending all your campaigns straight to the spam folder, effectively making you invisible to your entire list.
Here’s a quick breakdown of how these metrics signal different things:
| Metric | What It Indicates | Healthy Benchmark | Action to Take |
|---|---|---|---|
| Bounce Rate | The quality and accuracy of your email list data. | Below 2% | Immediately remove hard bounces; monitor soft bounces. |
| Unsubscribe Rate | Content relevance and audience alignment. | Below 0.2% | Treat as healthy list hygiene; analyze spikes for issues. |
| Spam Complaint Rate | Whether your emails are perceived as unwanted. | Below 0.1% | Investigate immediately; review opt-in process and content. |
The best way to keep these numbers in check is to prioritize quality over quantity. Always use a double opt-in process where new subscribers have to click a link in a confirmation email. This proves the address is real and that the person genuinely wants to join your list. On top of that, make it a habit to regularly clean out inactive subscribers who haven't opened an email in months. By managing these fundamental health metrics, you give your amazing emails the best possible chance of being seen, clicked, and loved.
Connecting Email Performance to Revenue

While metrics like opens and clicks tell a great story about engagement, they don't always speak the language of the C-suite. To truly prove your worth, you have to connect your email campaigns directly to the bottom line. This is where you graduate from measuring interest to measuring real, tangible business results.
Think of it this way: your engagement metrics are like reviews for a new restaurant. They tell you people like the atmosphere and the menu. But the revenue-focused metrics? They're the cash register receipts—they show you exactly how much money the restaurant actually made. Both are important, but only the receipts prove you're profitable.
Defining Your Conversion Rate
The most direct path from email to results is through the Conversion Rate. This is simply the percentage of email recipients who take a specific, desired action after clicking a link in your email. It’s the ultimate measure of whether your campaign successfully convinced people to do something valuable for your business.
A "conversion" isn't always a direct sale, though. It's whatever goal you set for that particular campaign.
Here are a few common examples of what a conversion might look like:
- Making a purchase from your Shopify store.
- Signing up for a webinar you're hosting.
- Downloading a whitepaper or case study.
- Booking a demo with your sales team.
- Filling out a lead generation form on a landing page. Deciding on your goal upfront is absolutely crucial. It gives your campaign a clear purpose. Without a defined conversion, you're just sending emails into the void, hoping for the best.
Calculating Your True Return on Investment
Once you know what a conversion is, you can start following the money. In the business-to-business (B2B) world, email marketing is a powerhouse for driving financial results. In fact, a stunning 59% of B2B marketers point to email as their single highest revenue-generating channel. That just goes to show how effective it can be when you measure it correctly. You can dig deeper into these powerful B2B email marketing statistics to see its full potential.
To calculate your own campaign's financial success, you need to zero in on the key email marketing metrics that translate those clicks into dollars and cents.
Let’s break down the three most important ROI-focused metrics you should be tracking for every single campaign.
Revenue Per Email and Average Order Value
Two of the most powerful numbers for showing financial impact are Revenue Per Email (RPE) and Average Order Value (AOV). They cut through the noise and give you a clear, monetary value for your efforts.
- Revenue Per Email (RPE): This is a simple but incredibly telling metric. It calculates the average revenue generated for every single email you send. A higher RPE means your campaigns are extremely efficient at turning subscribers into paying customers.
- Average Order Value (AOV): This one tracks the average dollar amount spent by each customer who converts from your email. A high AOV from a specific email might tell you that the products you featured or the discount you offered successfully nudged customers to add more to their cart. Here is how they all work together:
| Metric | What It Measures | Why It's Important |
|---|---|---|
| Conversion Rate | The percentage of people who take a desired action. | Measures the persuasive power of your campaign's content and offer. |
| Revenue Per Email | The average income generated from each email sent. | Shows the overall financial efficiency of your email program. |
| Average Order Value | The average amount spent per converting customer. | Reveals how your emails influence customer spending habits. |
For Shopify store owners using tools like Checkout Links, tracking these metrics becomes even easier. You can create specific, trackable links for your email campaigns that automatically apply discounts or even pre-fill a customer's cart. This smooth experience not only gives your conversion rate a nice boost but also provides crystal-clear data on which emails are driving the most valuable sales. By connecting each campaign directly to the checkout process, you can measure your AOV and RPE with incredible accuracy, turning every email send into a valuable data-gathering opportunity.
How to Set Realistic Performance Benchmarks
So, what’s a "good" open rate? Is a 2% click-through rate a sign of success or a total flop? Honestly, there’s no single right answer. It depends. Chasing a universal number without understanding the context is like a sprinter trying to beat a marathon runner's time—they're running completely different races.
Your performance is always relative. The success of your email marketing metrics is shaped by your specific circumstances, including your industry, your audience, and even the type of email you’re sending. A flash sale promo to your B2C customers will naturally look different from a B2B webinar invitation sent to C-suite executives.
Start with Industry Averages
Before you can set your own goals, you need a feel for the playing field. Industry benchmarks give you that crucial starting point, offering a general idea of how you stack up against others in your space. To truly see where your campaigns land, it's worth exploring the latest email marketing benchmarks.
For example, a marketing agency might see an average open rate of around 20%, while a government organization could hit closer to 30%. Knowing these general figures helps you set goals that are ambitious but still grounded in reality. Performance also shifts based on where your audience is. In 2025, Poland leads with the highest click-to-open rate at 6.90%, while Africa's is the lowest at 4.06%. Similarly, global B2B emails average a 15% open rate and a 2.4% CTR.
To put this into perspective, let's look at how some key industries compare. The table below shows just how much "average" can vary from one sector to another.
Email Marketing Benchmarks by Industry
| Industry | Average Open Rate | Average CTR | Average CTOR |
|---|---|---|---|
| Retail | 21.3% | 2.5% | 11.7% |
| Non-Profit | 25.2% | 2.8% | 11.1% |
| Health & Fitness | 20.8% | 3.2% | 15.4% |
| Software & SaaS | 20.5% | 2.6% | 12.7% |
While this data gives you a helpful snapshot, it shouldn't be your ultimate source of truth. After all, the most important benchmark you have is your own history.
Establish Your Own Internal Baseline
The real secret to sustainable improvement? Stop obsessing over what everyone else is doing and start competing with yourself. Your number one goal should be to establish your own internal benchmarks by tracking your performance over time.
This infographic shows a perfect example of this in action. By tracking conversion metrics over six months, you can easily spot trends and pinpoint opportunities to get better.
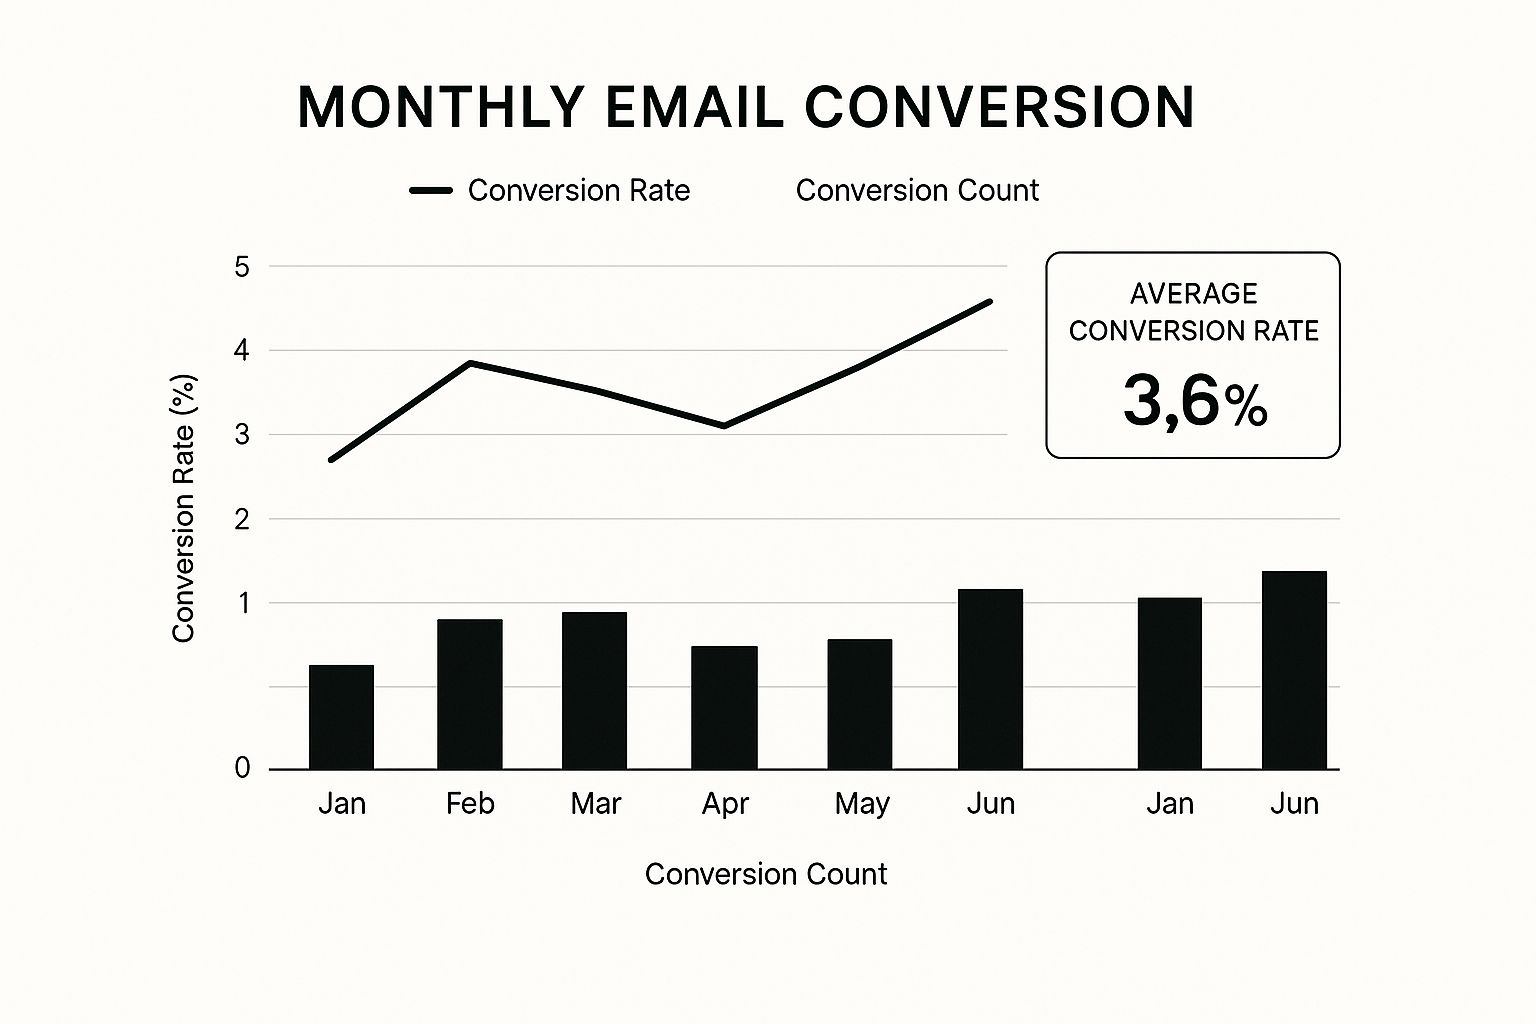
Watching your own trendlines—like the month-over-month increase in conversions shown above—will give you far more actionable insights than any static industry report ever could.
Here’s how you can get started:
- Track Everything: Get into the habit of recording the key metrics for every single campaign you send.
- Calculate Your Averages: After a few months, figure out your average open rate, CTR, and conversion rate. That's your new baseline.
- Set Incremental Goals: Forget about massive leaps. Aim for small, steady improvements, like trying to bump your CTR by 0.2% next month or boosting your conversion rate by 5% next quarter. When you focus on your own trends, you can set realistic goals that are perfectly aligned with your audience and your business. This approach gives you the context you need to understand your performance and find your biggest opportunities for improvement.
A Practical Playbook for Improving Your Metrics
https://www.youtube.com/embed/TxUas-7TXvU
Knowing your numbers is one thing, but making them better is a whole different ball game. This is where we roll up our sleeves and turn data into real results. A smart strategy isn't just about watching your performance; it's about actively using specific tactics to move the needle on your email marketing metrics.
The first step is getting your tools in order. Your Email Service Provider (ESP) is a great starting point, giving you the basics like open and click rates. But to really understand the full customer journey—from that first click in an email to the final purchase—you need to connect it with a tool like Google Analytics. This gives you a complete picture of how your emails influence what people do on your website.
Here’s a glimpse into a typical Google Analytics dashboard, which lets you track where your traffic is coming from and how users from your email campaigns are engaging.
This view shows you exactly how many people came from your email campaigns and how long they stuck around, giving you clear evidence of engagement that goes far beyond just the inbox.
Matching Strategies to Metrics
Once your tracking is solid, you can start targeting specific metrics with the right strategies. Think of it like a feedback loop: a low number tells you where the leak is, and a specific tactic is your wrench to fix it.
- Low Open Rate? This is almost always about your subject line and preheader text. A/B testing is your best friend here. Try out different ideas to see what your audience responds to. Pit short subject lines against long ones, questions against statements, or see if a well-placed emoji or a touch of personalization grabs their attention.
- Low Click-Through Rate (CTR)? So, they're opening the email but not clicking. The problem is inside. Take a hard look at your email’s content and design. You need a clear visual path that leads the reader’s eye straight to your call-to-action (CTA). Make your CTA buttons pop, use action-packed words, and give people a genuinely good reason to click.
- Low Conversion Rate? If clicks aren’t leading to sales or sign-ups, the issue might not be the email itself, but what happens after the click. Is your landing page confusing? Does the offer match what you promised in the email? The experience needs to be smooth and consistent.
Automating for Better Results
The good news is that many of these improvement strategies can be set to run on their own. For example, you can build automated email sequences that send based on what a user does (or doesn't do). It's a powerful way to deliver the right message at the perfect moment, without you having to lift a finger.
If you run a Shopify store, you can see huge improvements by using apps that beef up your automation. Our guide on email marketing automation walks you through setting up workflows like abandoned cart reminders with pre-filled checkouts. These kinds of automations can recover lost sales and boost your conversion rates, turning your email marketing from a decent performer into a revenue-driving machine.
Your Top Email Metrics Questions, Answered
As you get more comfortable with email marketing, you'll naturally start asking more practical questions. Moving from knowing what a metric is to knowing what to do with it is where the real learning happens. Let's tackle some of the most common questions that pop up.
Think of these answers as your guide to building a solid routine around your data. The goal is to make checking your analytics less of a chore and more of a powerful habit that directly fuels your success.
How Often Should I Check My Email Metrics?
There’s no magic number here; the right frequency really depends on what you’re trying to accomplish with your campaigns. A better approach is to think in tiers.
- Daily Glance: If you're running a time-sensitive campaign, like a 24-hour flash sale, a quick daily check on deliverability and engagement is a must. It helps you spot and fix any technical hiccups right away.
- Weekly Deep Dive: Set aside time once a week to dig a little deeper. This is the perfect moment to analyze your Click-Through Rate (CTR) and Click-to-Open Rate (CTOR) to see what content is truly hitting the mark with your audience.
- Monthly or Quarterly Strategy Session: This is where you zoom out for the big picture. Compare your performance against your own benchmarks and industry averages to inform your high-level strategy for the next quarter.
Is a High Unsubscribe Rate Always a Bad Thing?
Surprisingly, no. Of course, a sudden, massive spike in unsubscribes after a specific email is a red flag you should investigate immediately. But a low, steady unsubscribe rate is actually a sign of a healthy email list.
Think of it as your list cleaning itself. When subscribers who've lost interest opt out, they’re doing you a favor. Your remaining audience is more engaged, which improves your metrics and helps protect your all-important sender reputation. You're left with a core group of people who genuinely want to hear from you.
Why Is My Click-to-Open Rate So Important?
Your Click-to-Open Rate (CTOR) has stepped into the spotlight, largely overshadowing the traditional Open Rate for one simple reason: it tells a truer story. With privacy features like Apple's Mail Privacy Protection inflating open rates, you can't always trust that data.
CTOR cuts right through the noise. It focuses on the people who not only opened your email but were also compelled enough by your message to click a link. This makes it the single best measure of how relevant and persuasive your content actually is to the audience who truly saw it.
Ready to turn those clicks into cash? Checkout Links helps Shopify merchants create seamless, trackable buying journeys right from their emails. You can recover more abandoned carts and boost revenue by sending customers pre-filled checkout links that make purchasing a breeze. See how Checkout Links works.