Email Marketing KPI Mastery for Campaign Success
Email marketing KPIs, or Key Performance Indicators, are the specific metrics you use to see if your email campaigns are actually working. They’re the hard numbers that tell you what’s hitting the mark, what’s falling flat, and how your efforts are contributing to your overall business goals.
What Are Email KPIs and Why They Matter
Imagine you're piloting a plane. Your KPIs are the dials and gauges on your dashboard—the altimeter, the fuel gauge, the compass. Without them, you’re just flying blind, hoping you’re headed in the right direction and not about to run out of fuel. That's what running an email campaign without tracking KPIs is like.
These metrics turn your marketing from a shot in the dark into a science. They give you concrete feedback, answering the big questions: Are my subject lines grabbing anyone's attention? Does my content make people want to act? Are these emails actually making us money?
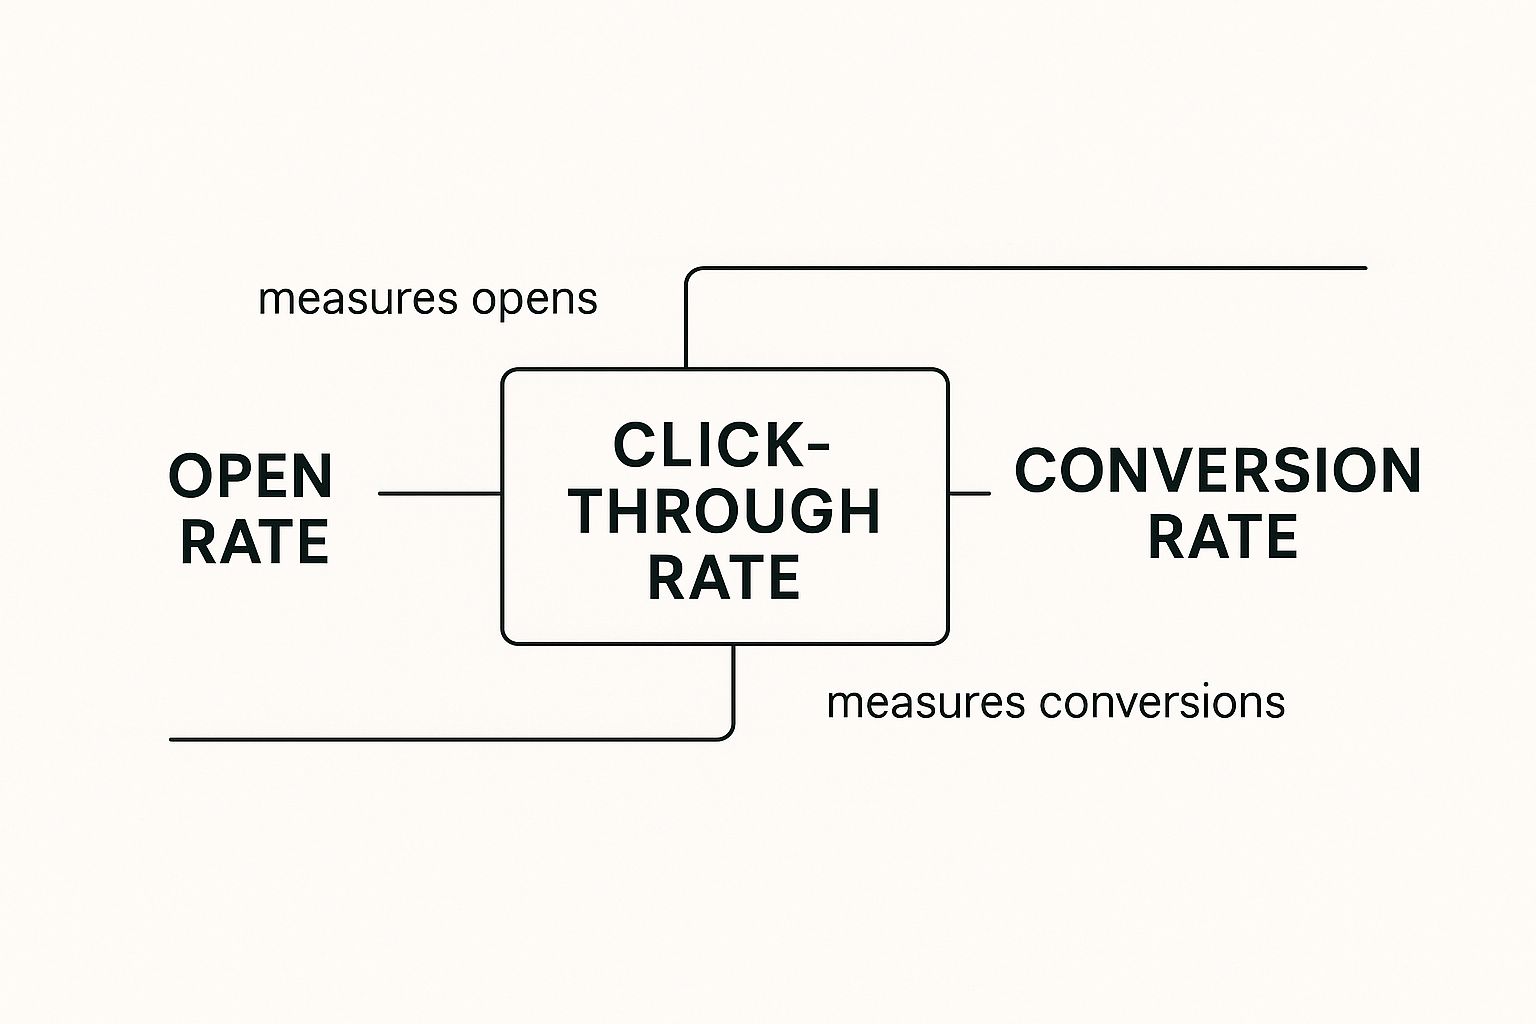
When you track the right things, you can spot problems and fine-tune your performance. For instance, if you have a great open rate but a terrible click-through rate, that’s a huge clue. It tells you your subject line was compelling, but the content inside didn't deliver on the promise. That insight is gold—it lets you adjust, test, and improve.
The Foundation of Smart Marketing Decisions
If you're not tracking performance, you're just guessing. That leads to wasted time, squandered money, and campaigns that completely miss the mark with your audience. Solid KPI tracking gives you the clarity you need to make decisions that actually grow your business.
Here’s why keeping a close eye on your email marketing KPIs is a must:
- Prove Your Worth: Hard data like conversion rates and ROI show stakeholders that your email program is a valuable asset, not just a cost center.
- Sharpen Your Strategy: Metrics show you exactly what your audience loves (and hates), so you can create more of what works.
- Find and Fix Leaks: KPIs are like an early warning system, flagging everything from deliverability issues to a confusing call-to-action.
- Build Better Relationships: Understanding what resonates helps you send more relevant, valuable emails, which builds trust and loyalty over time. To get a clear picture of how these core metrics fit together, here's a quick overview.
Your At-a-Glance Guide to Essential Email KPIs
This table breaks down the four most fundamental email marketing KPIs. Think of these as the "big four" that form the bedrock of any successful email strategy.
| KPI | What It Measures | Why It's Important |
|---|---|---|
| Open Rate | The percentage of recipients who opened your email. | Gauges the effectiveness of your subject line and sender reputation. |
| Click-Through Rate (CTR) | The percentage of recipients who clicked on a link in your email. | Shows how engaging your email content and call-to-action are. |
| Conversion Rate | The percentage of recipients who completed a desired action (e.g., purchase, sign-up). | Directly measures the campaign's success in achieving its primary goal. |
| Unsubscribe Rate | The percentage of recipients who opted out of your email list. | Indicates audience satisfaction and the relevance of your content. |
Each of these metrics provides a unique piece of the puzzle, helping you understand different aspects of your campaign's performance from initial engagement to final action.
One of the first metrics everyone looks at is the open rate. It’s simply the percentage of people who opened your email. While the industry average hovers around 42.35%, this number needs context. Modern privacy features, like Apple's Mail Privacy Protection, can sometimes inflate it, so it's best viewed alongside other engagement metrics.
Getting these fundamentals down is your first step. To go even further, you can explore a wider range of email marketing key performance indicators in our detailed guide.
Mastering the Core Four Engagement KPIs
Once your email makes it past the velvet rope and into the inbox, the real work begins. Did they open it? Did they read it? Did they do anything? This is where we stop worrying about deliverability and start obsessing over the core four engagement KPIs. These are the numbers that tell you if your campaigns are actually connecting with people.
Think of these four metrics like a chain reaction. Your Open Rate has to happen first, which then gives your Click-Through Rate a chance, and so on down the line. Seeing how they influence each other is the secret to figuring out what’s working, what’s broken, and how to get better results from every email you send.
Open Rate: The First Handshake
The Open Rate is simply the percentage of people who opened your email. It's usually the first number marketers glance at, and for good reason—it’s a direct reflection of your subject line, preheader text, and sender name. A good open rate means you won the first battle: getting noticed in a chaotic inbox.
But here's a crucial caveat: you have to take this metric with a grain of salt. Thanks to privacy features like Apple's Mail Privacy Protection (MPP), open rates can get a bit inflated. MPP often pre-loads email images, which triggers the tracking pixel and counts an "open" before a human ever lays eyes on it.
So, instead of treating it as gospel, use the open rate for comparison. It's still one of the best ways to A/B test your subject lines. Pitting one against the other in the same campaign will quickly tell you which message packed a bigger punch.
Click-Through Rate: The Conversation Starter
This is where things get interesting. The Click-Through Rate (CTR) tracks the percentage of your recipients who clicked on at least one link in your email. I'd argue this is one of the most vital metrics because it signals real, active interest. An open can be accidental; a click is a choice.
A strong CTR is proof that your email's content, design, and call-to-action (CTA) all worked together to convince someone to take the next step. It shows that the promise you made in your subject line was actually delivered inside the email.
If you're seeing high open rates but your CTR is in the gutter, that's a huge red flag. It almost always points to one of these culprits:
- A Bait-and-Switch: The subject line was fantastic, but the content inside had nothing to do with it.
- A Weak CTA: Your call-to-action was vague, buried, or just plain uninspiring.
- Clumsy Design: The email looked messy, was impossible to read on a phone, or the links weren't obvious. This relationship between metrics is the key to understanding your campaign's performance. You can see how one flows into the next.
Each metric builds on the one before it, creating a natural funnel that guides a subscriber from just being aware to actually taking action.
Click-to-Open Rate: The True Engagement Litmus Test
While CTR measures clicks against everyone you sent the email to, the Click-to-Open Rate (CTOR) gets more specific. It measures how many of the people who actually opened your email went on to click a link. This makes CTOR a much sharper tool for judging your content's quality, since it isolates the audience that actually saw your message.
CTOR helps you answer a more focused question: "Of the people who were interested enough to open this, how many found the content compelling enough to click?" It takes the subject line's performance out of the equation and puts the spotlight squarely on your email's body, design, and offer.
A healthy CTOR, typically floating somewhere between 20% and 30%, is a fantastic sign. It tells you that your message is hitting the mark with your most engaged subscribers. If your CTOR is low, it’s a clear signal that the substance of your emails needs a rethink.
Conversion Rate: The Ultimate Goal
And finally, we get to the metric that really matters to the business: the Conversion Rate. This KPI tracks the percentage of people who not only clicked a link in your email but also completed the specific action you wanted them to take on the other side.
That "action" is your campaign's goal. It could be anything:
- Making a purchase
- Filling out a contact form
- Downloading a whitepaper
- Registering for a webinar This is the number that ties your email marketing directly to revenue and business growth. If you have a sky-high CTR but a rock-bottom conversion rate, your email probably did its job perfectly—but your landing page dropped the ball. That insight is gold. It tells you exactly where to focus your optimization efforts to fix the leak.
By truly understanding these four core engagement KPIs, you can graduate from just sending emails to building a smart, data-driven strategy. You learn to listen to what your numbers are telling you, find the weak spots in your campaigns, and make changes that drive real, meaningful results.
Gauging Your List Health and Deliverability

You can write the world's greatest email, but it's completely useless if it never lands in the inbox. While all the fancy engagement metrics tell you what happens after your email arrives, deliverability KPIs are the gatekeepers. They decide if you even get a chance.
A clean, healthy email list is the absolute foundation of any good email strategy. These metrics are its vital signs.
Think of your sender reputation as your passport for getting into an inbox. The big Internet Service Providers (ISPs) like Gmail and Outlook are the border control agents. A high bounce rate is like a big red flag on your passport—it tells them you might not be a trustworthy sender, making it harder for all your future emails to get through.
Bounce Rate: The Red Flag of List Health
Your Bounce Rate is simply the percentage of your emails that couldn't be delivered. But not all bounces are created equal, and knowing the difference is the key to diagnosing what's wrong with your list.
You’ll see two main types of bounces:
- Hard Bounces: These are permanent failures. They happen when you send an email to an address that's invalid, closed, or just plain doesn't exist. It’s the digital version of a "Return to Sender, Address Unknown" stamp.
- Soft Bounces: These are temporary hiccups. The most common culprits are a full inbox, a server that’s temporarily offline, or an email that’s just too large to be accepted. A single hard bounce isn't a catastrophe, but a consistently high hard bounce rate is a huge problem. It’s a direct signal to ISPs that your list is stale or poorly managed. For a deeper look at keeping your emails out of the void, you can find great strategies to improve email deliverability. Most marketers I know aim to keep their bounce rate well below 2%.
Unsubscribe Rate: Feedback in Disguise
The Unsubscribe Rate tracks the percentage of subscribers who opt out after getting one of your emails. It's so easy to see this number as a failure, but honestly, it’s one of the most valuable feedback loops you have.
A high unsubscribe rate is a clear sign there’s a disconnect between what you're sending and what your audience actually wants.
Instead of panicking, use this KPI as a diagnostic tool. Did you see a spike in unsubscribes after a specific campaign? That tells you something important:
- Maybe your content wasn't relevant to that segment.
- Perhaps you're sending emails too often.
- The value you delivered didn't live up to the promise in your subject line. While a rate floating around 0.2% is pretty standard, if you see it consistently creeping above 0.5%, it's time to take a hard look at your content and segmentation. Remember, an unsubscribe is always better than being marked as spam—that does way more damage to your reputation.
List Growth Rate: The Engine of Sustainability
Your email list is a living thing, not a static spreadsheet. People will naturally unsubscribe or let their email addresses go dormant. The List Growth Rate measures how quickly you're adding fresh subscribers to offset those you're losing. This KPI is all about making sure your audience is being replenished with new, interested people.
Calculating it is straightforward: take your number of new subscribers, subtract the unsubscribes, divide that by your total list size, and then multiply by 100. Tracking this month-over-month will tell you if your acquisition efforts are keeping up with natural churn.
Real, sustainable growth comes from quality, not just quantity. Avoid the temptation to buy email lists. It almost always backfires, leading to sky-high bounce rates, a flood of spam complaints, and a trashed sender reputation.
Instead, focus on organic growth that pulls the right people in:
- Offer valuable lead magnets like ebooks, webinars, or checklists.
- Place clear opt-in forms on your blog and key website pages.
- Run social media campaigns that are designed to drive email sign-ups. By keeping a close eye on these deliverability and list health KPIs, you stop just sending emails and start cultivating a high-quality, engaged audience that actually wants to hear from you. That proactive management is the real key to long-term success.
Connecting Email KPIs to Revenue and ROI

Let's be honest. Open rates and click-through rates are great, but they don't keep the lights on. The real test of your email marketing efforts is connecting those clicks and opens to the metrics that matter most to the business: revenue, profit, and return on investment.
These financial KPIs are the bridge between your campaign dashboard and the company's bottom line. When you can master them, you're not just sending emails anymore—you're a growth driver with the numbers to prove it.
Calculating Your Campaign Return on Investment
If there's one metric that speaks loudest in the boardroom, it's Return on Investment (ROI). It cuts through the noise and answers the single most important question: "For every dollar we put into this email campaign, how many dollars did we get back?"
Calculating it is actually pretty straightforward. You take the revenue the campaign brought in, subtract what it cost to run, and then divide that number by the cost.
Imagine an e-commerce store runs a promotion for a new product line.
- Total Revenue Generated: $5,000
- Campaign Costs (ESP fees, designer time, etc.): $500
- Calculation: (5,000 - 500) / $500 = 9 The result is a 9x ROI, or 900%. That's a number that gets attention. It clearly shows that for every single dollar spent, the campaign brought back nine.
To track this accurately, you need to connect your email service provider (ESP) to your e-commerce or analytics platform. This link allows you to attribute sales directly to specific emails, giving you a clear line of sight from campaign to cash flow. For a more detailed walkthrough, check out our guide on https://checkoutlinks.com/blog/how-to-measure-email-marketing-success.
Decoding Revenue Per Email
While ROI gives you the big-picture summary, Revenue Per Email (RPE) zooms in on the performance of each individual message. This metric tells you the direct monetary value of every single email you send out.
The formula is simple:
Total Revenue from a Campaign / Number of Emails Delivered
Let's stick with our e-commerce example. The campaign generated $5,000 and successfully delivered 10,000 emails.
- Calculation: 5,000 / 10,000 = 0.50 This means every email that landed in an inbox was worth, on average, $0.50. RPE is a fantastic metric for A/B testing because it helps you decide a winner based on profit, not just clicks. You can test two different subject lines and see which one actually generates more cash.
Valuing Each Subscriber on Your List
Another powerful financial KPI is Revenue Per Subscriber (RPS). This one helps you understand the long-term value of your audience by calculating what each person on your list is worth to the business over time.
To figure it out, just divide the total email revenue from a specific period (like a month or a quarter) by your total number of subscribers.
Total Email Revenue (in a period) / Number of Subscribers
So, if your email program brought in $20,000 last quarter and you have 8,000 subscribers:
- Calculation: 20,000 / 8,000 = 2.50 On average, each subscriber is worth 2.50 per quarter. This isn't just a vanity metric; it directly informs your acquisition strategy. If you know a subscriber is worth 2.50, you can confidently spend up to that amount to get a new one and know you'll break even.
Tying your email efforts to these financial outcomes is what separates good marketers from great ones. If you want to expand this thinking to your wider efforts, explore these strategies to measure and improve your content marketing ROI. By consistently tracking these money-focused metrics, you shift from being just a marketer to being an indispensable part of the business's growth engine.
Choosing the Right Tools for KPI Tracking

You can't improve what you don't measure, but you can't measure anything without the right tools. Think of tracking your email KPIs like a chef in a kitchen—you need sharp knives and quality pans to turn good ingredients (your data) into a delicious meal. Your toolkit is what transforms raw numbers into genuinely useful insights.
The good news? You don't need a massive, expensive tech stack to get started. In fact, the best place to begin is probably somewhere you're already very familiar with: your email service provider (ESP).
Start with Your Email Platform Dashboard
Every solid ESP, whether you're using Mailchimp, Klaviyo, or HubSpot, comes equipped with a built-in analytics dashboard. This is your command center, designed to give you a clear, immediate snapshot of how your campaigns are doing.
As soon as you send an email, these platforms get to work tracking all the essential metrics. With just a few clicks, you can pull up reports that show you:
- Open Rates: Are your subject lines grabbing attention?
- Click-Through Rates: Is your content compelling enough to earn a click?
- Bounce and Unsubscribe Rates: How healthy and engaged is your list? These native dashboards are perfect for taking a quick pulse check. For instance, right after launching a promo, you can hop into your ESP and see almost instantly how many people are opening it and which links they're clicking.
Go Deeper with Google Analytics
Your ESP tells you what happens in the inbox, but its story ends the moment a subscriber clicks a link. To see what happens after the click, you need a web analytics tool. This is where Google Analytics becomes your best friend.
By connecting your email campaigns to Google Analytics, you can follow the entire customer journey, from that initial click all the way to a thank you page.
The magic that makes this possible is a little snippet of code called a UTM parameter (Urchin Tracking Module). Think of UTMs as simple tags you add to the end of your links that tell Google Analytics exactly where that visitor came from.
A link with UTMs will usually contain a few key pieces of information:
- utm_source: Tells you where the traffic originated (e.g.,
klaviyo,newsletter). - utm_medium: Specifies the marketing channel (which is always
emailfor us). - utm_campaign: Names the specific campaign, so you know what drove the click (e.g.,
summer-sale-2024). When someone clicks a link tagged this way, Google Analytics logs all that info. Suddenly, you can see not just that people clicked, but that your "summer-sale-2024" campaign brought in $5,000 in sales. This is how you finally measure true ROI.
Thankfully, most ESPs have built-in features to add these UTM tags to your links automatically, so you don't have to do it by hand. This connection is the key to measuring heavy-hitting financial metrics like Revenue Per Email and proving that your email program is a profit center for the business.
Pairing your ESP with Google Analytics is how you graduate from tracking simple engagement to tracking real, bottom-line impact.
A Quick Look at Your Tool Options
To help you decide where to focus your attention, here’s a quick rundown of the different types of tools and what they’re best for.
| Tool Type | Primary Function | Key Metrics Tracked | Best For |
|---|---|---|---|
| Email Service Provider (ESP) | Sending campaigns & tracking inbox behavior | Open Rate, Click-Through Rate, Unsubscribe Rate, Bounce Rate | Day-to-day campaign monitoring and list health management. |
| Web Analytics Platform | Tracking on-site user behavior | Conversion Rate, Revenue Per Email, Average Order Value | Measuring ROI and understanding post-click customer journeys. |
| Customer Data Platform (CDP) | Unifying customer data from all sources | Customer Lifetime Value (CLV), List Growth Rate, Segmentation performance | Getting a 360-degree view of the customer and tracking long-term value. |
| Heatmap & Session Replay Tools | Visualizing user interaction on-site | Click maps, scroll depth, user recordings | Understanding exactly what email subscribers do after landing on your site. |
Each tool gives you a different piece of the puzzle. Starting with your ESP and Google Analytics gives you a powerful foundation, and you can always add more specialized tools as your needs grow.
An Actionable Playbook to Improve Your KPIs
https://www.youtube.com/embed/R0263nDBQAI
Knowing your email marketing KPI data is one thing, but actually using those numbers to get better results is where the real growth happens. This is your go-to guide for turning those insights into action.
When a campaign doesn't perform as well as you'd hoped, you can almost always trace it back to a specific weak spot. Instead of just guessing what went wrong, your KPIs can act like a roadmap, pointing you directly to the problem so you can apply a targeted fix.
Boosting Low Open Rates
If your open rates are in a slump, you're losing the battle before your email even gets seen. The problem almost always comes down to a weak first impression in the inbox. Your subject line, sender name, and that little snippet of preheader text are the only things you have to convince someone to click.
Here’s how to make that first touchpoint count:
- A/B Test Your Subject Lines: Stop guessing what works. Test a question against a statement. Try a short, punchy line versus a more descriptive one. The data will tell you exactly what your audience prefers.
- Optimize Your Send Time: Sending an email at 2 AM on a Saturday is just asking for it to be ignored. Dig into your analytics to see when your subscribers are actually online and active, then schedule your campaigns to land in their inbox right at that sweet spot.
- Personalize the Preview: Using merge tags to pop a subscriber's first name or company into the subject line is a simple touch that can make your email feel like it was sent just for them, not to a massive list. Going a step further, mastering cold email personalization can dramatically improve how people engage with your emails and make your campaigns far more effective.
Fixing Poor Click-Through Rates
Getting a high open rate but a low click-through rate (CTR) is a classic sign of a disconnect. It means your subject line made a great promise, but the email itself didn't deliver on it. The key is to make your call-to-action (CTA) impossible to ignore and ensure your design is clean and easy to navigate.
First, check your CTA button. Is it using active, exciting language like "Get Your Free Guide" instead of a boring word like "Submit"? Next, make sure it has plenty of white space around it so it really pops off the page.
Finally, you have to confirm your email is 100% mobile-responsive. With more than half of all emails now opened on phones, a clunky, hard-to-read design will absolutely kill your CTR. No one is going to pinch and zoom to find your link.
Your Top Questions About Email Marketing KPIs, Answered
Even when you know the key metrics, things can get a little fuzzy when you start applying them to your own campaigns. Let's clear up some of the most common questions that pop up when you're in the trenches with your email strategy.
What Is the Most Important Email Marketing KPI?
This is the million-dollar question, but the honest answer is: it depends entirely on what you're trying to achieve. There’s no single "best" KPI that rules them all.
Think of it like this: if you're running a brand awareness campaign, your main goal is getting eyeballs and sparking interest. In that case, Open Rate and Click-to-Open Rate (CTOR) are your best friends. But if you’re sending out a sales email, the only thing that really matters is how much money it made. That's where Conversion Rate and Revenue Per Email become the heroes.
The smartest approach is to pick one primary KPI that directly reflects your campaign's main goal. Then, keep an eye on a few secondary KPIs to get the full story of how people are interacting with your email from start to finish.
How Often Should I Check My Email Marketing KPIs?
It's tempting to hit refresh every five minutes after sending a campaign, but that's not the best use of your time. For regular sends like newsletters, give it 24-48 hours. Most of the action happens in that window, so you'll get a solid read on performance.
For longer, automated flows like a welcome series, checking in weekly or bi-weekly is plenty. This gives you enough data to spot real trends instead of just noise.
The big takeaway here is consistency. Don't get hung up on the results of one email. Set a regular schedule to look at your numbers. This helps you see the bigger picture and make strategic moves based on patterns, not panic.
How Does Apple's Mail Privacy Protection Affect My Open Rates?
Apple's Mail Privacy Protection (MPP) has definitely thrown a wrench in the works for open rates. In short, it can make your open rates look much higher than they actually are.
It works by automatically pre-loading email images—including the invisible tracking pixel that registers an open. This means an email can be marked as "opened" on Apple Mail even if your subscriber never laid eyes on it.
So, how do you deal with this? The answer is to stop treating open rate as your main indicator of success. Instead, shift your focus to metrics that require a deliberate action from your subscriber. Metrics like Click-Through Rate (CTR) and Conversion Rate are now more valuable than ever because they represent real, undeniable engagement.
Ready to turn abandoned carts into revenue? Checkout Links helps Shopify stores create powerful, pre-filled checkout links that integrate seamlessly into your email campaigns. Boost your email marketing ROI and recover more sales today. Learn more about how Checkout Links works.