How to Measure Email Marketing Success: A Practical Guide
To really know if your email marketing is working, you have to look past the easy numbers. It’s about tracking the metrics that actually impact your bottom line—things like conversion rates, click-through rates, and, of course, your return on investment (ROI).
The goal is to draw a straight line from every email you send to a real-world result, whether that's a sale, a new lead, or a bump in customer lifetime value.
First Things First: Define What Success Looks Like

Before you even think about opening a dashboard, you need to be crystal clear on what "success" means for your business. Honestly, tracking metrics without a solid goal is like sailing without a map—you're moving, but you have no clue if you're going the right way. Every single metric you watch should have a purpose.
This means you’ve got to get past the vanity metrics. Sure, open rates are interesting, but they don't tell you the whole story. A high open rate is nice, but it doesn't pay the bills if no one clicks through or buys anything. Your goals will look completely different depending on your business model, and that's okay.
Your Goals Depend on Your Business Model
If you're running an e-commerce brand on a platform like Shopify, your main goal is almost always going to be revenue. Plain and simple. Here, success is measured by how many sales a campaign drives. You might be aiming to get immediate purchases, win back abandoned carts, or nudge loyal customers into making another purchase.
On the other hand, a B2B SaaS company usually plays a longer game. The focus shifts to lead generation and nurturing. An instant sale isn't the objective; moving a prospect down the funnel is. Success in this world is measured by things like demo requests, webinar sign-ups, or free trial starts that came from an email.
Then you have publishers or content creators. For them, it's all about building a loyal audience. The main goal is to cultivate a dedicated readership. Success is measured by stats that show a strong community, like high click-through rates on articles, super low unsubscribe rates, and seeing your emails get forwarded.
When you take the time to set these clear objectives upfront, you build a framework for measurement that tells a powerful story. You won’t just know what happened; you’ll understand why it happened. And that turns raw data into a strategic roadmap for growth.
Focusing on the Email Metrics That Actually Matter

Alright, you’ve set your goals. Now comes the part where we measure what's actually happening. It’s incredibly easy to drown in a sea of data, but a successful email marketer knows to focus on the handful of Key Performance Indicators (KPIs) that truly signal a campaign's health.
Looking at one metric in isolation is like trying to understand a story by reading a single word from each page. It doesn't work. For instance, a sky-high open rate feels great, but if your click-through rate is in the basement, it tells you the subject line did its job, but the email itself fell flat. This is where you cut through the noise and start tracking what drives real results.
Moving Beyond Open Rates
Let's be blunt: open rates aren't what they used to be. While not entirely useless, they’ve become a vanity metric thanks to things like Apple's Mail Privacy Protection, which can artificially inflate the numbers. True engagement comes from tracking what people do after they open.
This is where a solid grasp of different click metrics becomes your secret weapon. Understanding the nuance between them is the key to correctly diagnosing your campaign's performance.
- Click-Through Rate (CTR): This is the percentage of your total recipients who clicked a link. Think of it as a broad health check on your campaign’s overall reach and initial hook.
- Click-to-Open Rate (CTOR): This measures the percentage of people who actually opened the email and then clicked. This is a far more powerful indicator of how compelling your email copy, design, and call-to-action really were. A strong CTOR proves your message resonated with the audience you managed to capture. While benchmarks vary by industry, aiming for a CTOR around 11% is a good starting point.
Connecting Clicks to Conversions
For most of us, the end goal isn't just a click; it's an action. A purchase, a sign-up, a download. This is your conversion rate—the percentage of recipients who followed through and completed that final step. This is the KPI that ties your email efforts directly to ROI.
To help you get a handle on the most important metrics, here’s a quick breakdown of the core KPIs every email marketer should have on their dashboard.
Core Email Marketing KPIs Explained
This table cuts through the jargon and explains what each key metric measures and, more importantly, why it should matter to you.
| Metric (KPI) | What It Measures | Why It Matters |
|---|---|---|
| Click-Through Rate (CTR) | The percentage of total recipients who clicked a link in your email. | Provides a high-level view of your campaign's initial appeal and reach. |
| Click-to-Open Rate (CTOR) | The percentage of recipients who opened the email and then clicked a link. | Directly measures how effective your email's content, layout, and call-to-action were. |
| Conversion Rate | The percentage of recipients who completed the desired action (e.g., purchase, signup). | This is the bottom-line metric that measures the campaign's ultimate success and ROI. |
| Unsubscribe Rate | The percentage of recipients who opted out of your email list after receiving a campaign. | A high rate can indicate a mismatch between your content and audience expectations or email fatigue. |
| Bounce Rate | The percentage of emails that couldn't be delivered to the recipient's inbox. | High bounce rates signal problems with your email list's health and can harm your sender reputation. |
As you analyze your own data, remember that these numbers tell a story together. A high unsubscribe rate, for instance, often points to a disconnect between what your audience expected and what you sent. You should always aim to keep this rate near 0.3%.
By taking a holistic view that includes everything from bounces to forwards, you get the clearest picture of your campaign's performance. For more context, it can be helpful to dive into broader email marketing statistics to see how your numbers stack up against industry averages.
Setting Up Flawless Tracking with UTM Parameters
If you can't see a click in your analytics, you can't measure its impact. It’s that simple. This is exactly why UTM parameters are one of the most essential tools in an email marketer's arsenal. These little tags, added to the end of your URLs, are what give you crystal-clear attribution. They tell your analytics platform precisely where your traffic came from, turning a vague "click" into a rich, measurable data point.
Think of it as leaving a detailed breadcrumb trail. Without UTMs, you just know someone showed up on your website. With them, you know they arrived from your "weekly_newsletter" (Campaign), clicked on the "main_cta_button" (Content), and are part of your "active_subscribers" segment. That level of detail is non-negotiable if you want to truly understand what's working.
Deconstructing the UTM Tags
A properly built UTM link tells a story using five key pieces. Getting these right is the foundation of accurate tracking.
- utm_source: This identifies where the traffic is coming from. For email, this is often your email service provider, like "klaviyo" or "mailchimp."
- utm_medium: This is the marketing channel itself. For every email you send, this should always, always be "email". Consistency is key here.
- utm_campaign: This names your specific promotion. Be descriptive and clear! Think "black_friday_2025" or "abandoned_cart_flow."
- utm_term: Originally for paid search keywords, you can get creative with this for email. It's great for differentiating audience segments, like "vip_customers" or "first_time_buyers."
- utm_content: This helps you tell apart different links within the same email. Was it the "header_link" or the "footer_logo" that got the click? Now you'll know. I can't stress this enough: you need a consistent naming convention. Messy UTMs lead to messy data, and messy data makes it impossible to draw reliable conclusions. Sit down with your team and create a clear framework to follow for every single campaign. For a deeper dive, our comprehensive guide on using UTM parameters for email offers a proven framework you can start using right away.
Seeing UTMs in Action
Let's walk through a real-world scenario. You're running a flash sale and send out a promotional email. A customer clicks on the main call-to-action. The URL they land on might look like this:
yourstore.com/products/flash-sale-item?utm_source=klaviyo&utm_medium=email&utm_campaign=july_flash_sale&utm_content=hero_image_cta
When that customer completes their purchase, Google Analytics will credit that sale directly to your "july_flash_sale" email campaign. Boom. You can now see the exact revenue that specific email generated. This is how you accurately calculate your conversion rate.
This infographic breaks down the basic logic behind measuring your conversion rate.
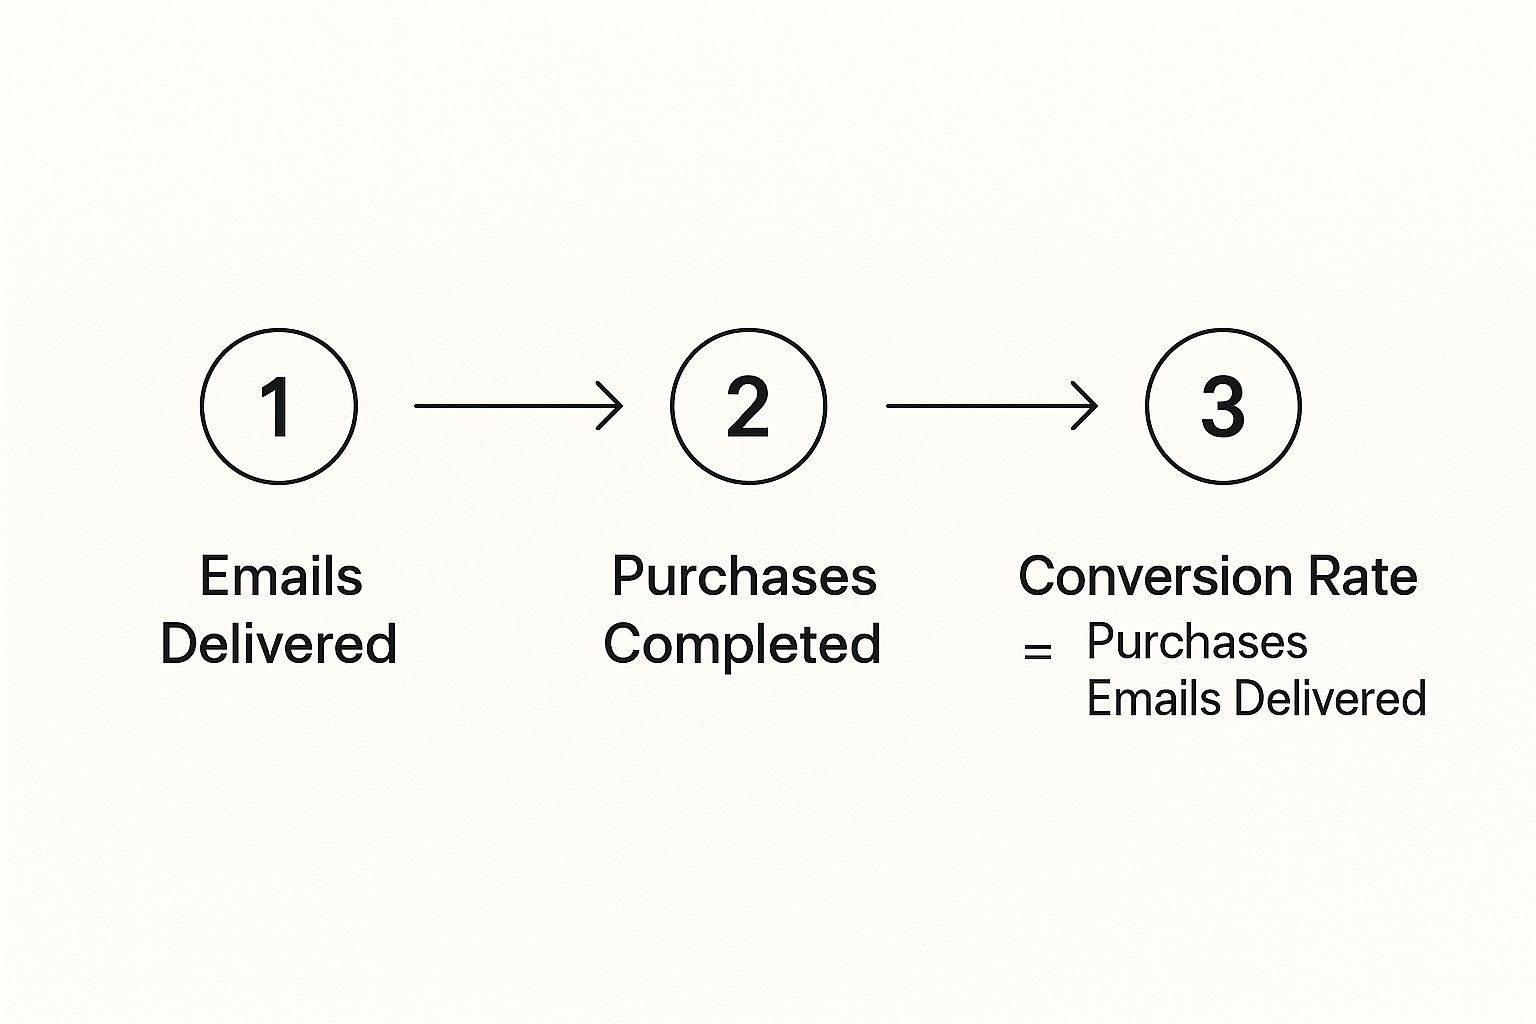
The image traces a direct path from email delivery to a final purchase, showing how a simple formula connects your marketing actions to real business results. It’s this connection that proves your email marketing ROI, which remains one of the highest in digital marketing.
In fact, email marketing is projected to deliver an average ROI of 3600% in 2025—that's about 36 for every ****1 spent. This performance is fueled by a global user base expected to reach 4.6 billion people. You can find more stats on this at EmailToolTester.com.
By meticulously tagging every link, you give your analytics the power to tell the full story. This is how you justify your budget, prove your worth, and make smarter decisions for your next campaign.
Finding Actionable Insights in Your Campaign Data

Collecting data is one thing; knowing what to do with it is where the real magic happens. To get a true sense of your email marketing success, you have to put on your detective hat and constantly ask "why" to figure out the story your metrics are trying to tell you.
Simply stating the facts—a 15% open rate or a 2% click-through rate—doesn't get you very far. The real goal is to understand why those numbers are what they are. Why did one subject line crush another? What do all the subscribers who bought something have in common?
When you start asking these questions, your data stops being a report card and becomes a playbook for your next campaign.
Digging Deeper with Audience Segmentation
Some of the best insights are hiding just beneath the surface. Looking at your campaign performance as one big number can easily mask important patterns. The trick is to segment your results to see how different pockets of your audience are reacting.
Here are a few ways I like to slice the data:
- New Subscribers vs. Long-time Customers: Are your brand-new followers engaging differently than your loyal fans? This can completely change how you approach your welcome series and ongoing content.
- High-Engagement vs. Low-Engagement Segments: Pit the behavior of your die-hard fans (those who open everything) against those who haven't clicked in 90 days. This is great for spotting your most resonant content and figuring out who needs a gentle nudge with a re-engagement campaign.
- Purchase History: This is a goldmine for e-commerce. Segmenting by what people have bought before or how much they typically spend is crucial. You might find a promo for one product category lights a fire under one group but gets completely ignored by another. By looking at your data this way, you move beyond guesswork. You might find that your witty, fun subject lines are a huge hit with new subscribers, but your big spenders prefer a more direct, benefit-focused message. That's a powerful insight you can use right away. If you need a refresher, check out our guide on the core email marketing metrics you should be segmenting.
Benchmarking and Trend Analysis
A single campaign is just one snapshot in time. The real power comes from seeing how your performance stacks up over time and against industry standards. A simple dashboard tracking your core metrics week-over-week and month-over-month is all you need to get started.
This historical view is fantastic for spotting trends. Is your click-to-open rate slowly dipping? It might be a sign your content is getting a little stale. Did your unsubscribe rate jump after one particular email? That’s a massive red flag telling you to figure out what went wrong.
Take email open rates, for example. In 2025, the global average open rate for brands is hovering around 22%. Knowing this gives you a baseline. If you're hitting 25% on Tuesdays—usually the best day for engagement—you’re doing great. But if you’re stuck at 15%, it’s a clear signal to start testing new subject lines or send times. You can explore more insights in these 2025 email engagement statistics.
From Guesswork to Growth: The Smart Way to A/B Test Your Emails
Looking at performance reports is one thing, but truly great email marketing is about using that data to build a smarter strategy for the next campaign. This is where A/B testing, also known as split testing, becomes your secret weapon. It’s how you stop making educated guesses and start making decisions backed by real, hard data.
The concept is straightforward. You create two versions of an email—a Variant A and a Variant B—but you only change one single thing between them. You send these out to a small, random slice of your list and see which one performs better. The winner then gets sent to everyone else.
This isn't just about throwing random changes at the wall to see what sticks. It's a focused, methodical process. By isolating one variable, you can see exactly how it affects your open rates, clicks, and ultimately, your sales.
What Should You Actually A/B Test?
Not all tests are worth your time. To get the most bang for your buck, you need to focus on the elements that can genuinely move the needle on your results. I always recommend starting with the "gatekeepers"—the things people see before they even open your email.
Subject Lines: This is the classic A/B test for a reason—it often yields the biggest impact. Try testing a direct, benefit-focused subject line against one that sparks a little curiosity. For example, "Save 25% on All T-Shirts" vs. "Your Weekend Wardrobe Is Waiting."
Sender Name: It might seem small, but this can make a huge difference. Does your audience prefer a personal touch, like "Sarah from Checkout Links," or the more official "The Checkout Links Team"? A quick test will give you the answer. Once you’ve got them to open the email, the next goal is getting that click.
Call-to-Action (CTA): This is where the magic happens. Test everything about your CTA button: the text ("Shop Now" vs. "Claim My Deal"), the color (a bright, contrasting color almost always wins), and even its placement (above the fold or at the very end).
Email Layout & Design: This can be a game-changer. I’ve seen clients get shocking results by pitting a simple, clean plain-text email against a gorgeous, image-heavy HTML version. You never know what will resonate until you test it.
How to Run a Test You Can Actually Trust
For your results to mean anything, you have to follow a couple of golden rules. First, and this is non-negotiable, only change one variable at a time. If you tweak the subject line and the CTA button in the same test, you’ll have no clue which change actually made the difference. It completely invalidates your results.
Second, your test group has to be large enough to achieve statistical significance. Don’t worry, you don’t need a degree in statistics for this. Most modern email platforms like Mailchimp or Klaviyo handle the math for you. They’ll typically suggest a test audience of 10-20% of your list, which is usually enough to ensure the results aren't just a random fluke.
Answering Your Top Email Measurement Questions
https://www.youtube.com/embed/vV3g5VuSrIQ
Even with the best tracking setup in the world, you’re still going to have questions. Email measurement can get tricky, and there are a few common stumbling blocks I see marketers run into all the time. Let's clear up some of that confusion with some straight answers.
One of the first things people ask is, "How often should I actually be checking my email stats?" Honestly, it all comes down to your campaign's timeline and how often you're sending. If you're running a massive Black Friday sale, you'll want to be glued to your dashboard, maybe even checking hourly to make quick pivots. But for your regular weekly newsletter? Give it 24-48 hours. That’s usually the sweet spot to see how it’s really performing.
What Is a Good Email Conversion Rate?
This is the classic "it depends" question, but for good reason. A "good" conversion rate isn't a universal number; it's completely relative to your industry, the price of your product, and even the type of email you sent. You can't expect an email selling a $2,000 course to convert at the same rate as one for a free PDF download.
Instead of getting hung up on industry benchmarks, focus on creating your own. Start by tracking your conversion rates consistently. If your abandoned cart emails are currently converting at 5%, your real goal should be to nudge that to 6%. That's a far more meaningful win than trying to match a random number from a totally different business.
Differentiating Hard Bounces and Soft Bounces
Getting a handle on the difference between a hard and soft bounce is non-negotiable. This is all about keeping your email list clean and protecting your sender reputation. A high bounce rate is a major red flag for email providers like Gmail and can seriously damage your ability to land in the inbox.
Here’s the simple breakdown:
- Hard Bounces: Think of these as a permanent "return to sender." The email address is flat-out invalid, fake, or doesn't exist anymore. These need to be immediately and automatically scrubbed from your list. No second chances.
- Soft Bounces: This is a temporary hiccup. Maybe the person's inbox is full, or the email server was down for a moment. Most email service providers will try resending a few times before giving up. Routinely cleaning hard bounces from your list is one of the most fundamental tasks in email marketing. It proves to inbox providers that you're a legitimate, responsible sender, which is your ticket to better deliverability. It's a foundational piece of measuring your success, because it ensures the pool of people you're sending to is actually real.
Checkout Links helps you finally see the true ROI from your emails by creating direct, shoppable links that connect every single click to a sale. Stop guessing and start measuring what really drives revenue. Learn how to supercharge your Shopify email marketing today.